Application
Geology, Critical Minerals, & Industrial Materials
Application
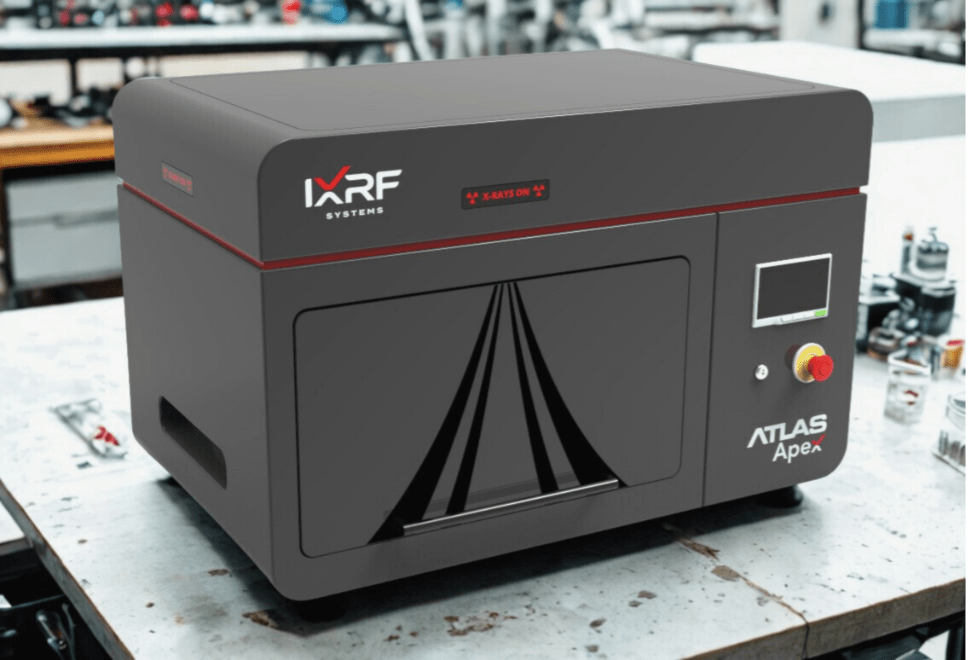
Atlas Apex microXRF for Mineral-Scale Characterization, Processing & QA/QC
Mineral-Scale Elemental Insight for Natural and Engineered Materials
IXRF Systems Atlas Apex microXRF delivers high-resolution, non-destructive elemental mapping for geology, critical minerals, mining, and industrial materials applications. With ≤10 µm spatial resolution, enhanced light-element sensitivity, and high-throughput multi-SDD detection, Atlas Apex connects bulk chemistry, mineralogy, and material performance—supporting USGS critical mineral programs, industrial processing optimization, and quality control without damaging valuable samples.
Why microXRF for Critical Minerals & Industrial Materials
See Chemistry in Its Structural and Mineral Context
Bulk techniques such as XRF, ICP, and wet chemistry quantify elemental totals, but often remove spatial, textural, and phase context. In both natural resource systems and industrial materials, understanding where elements reside—in which minerals, phases, or microstructures—is essential.
microXRF preserves spatial context, enabling direct visualization of elemental distributions across minerals, grains, inclusions, alteration fronts, reaction zones, and engineered phases.
Key Advantages
- 5–10 µm spatially resolved elemental data
- Direct visualization of critical minerals, REEs, and industrially relevant elements
- Non-destructive workflows for high-value, limited, or archived samples
- Minimal sample preparation compared to wet chemistry
- Applicable to rocks, ores, concentrates, tailings, cement, ceramics, slags, and industrial solids
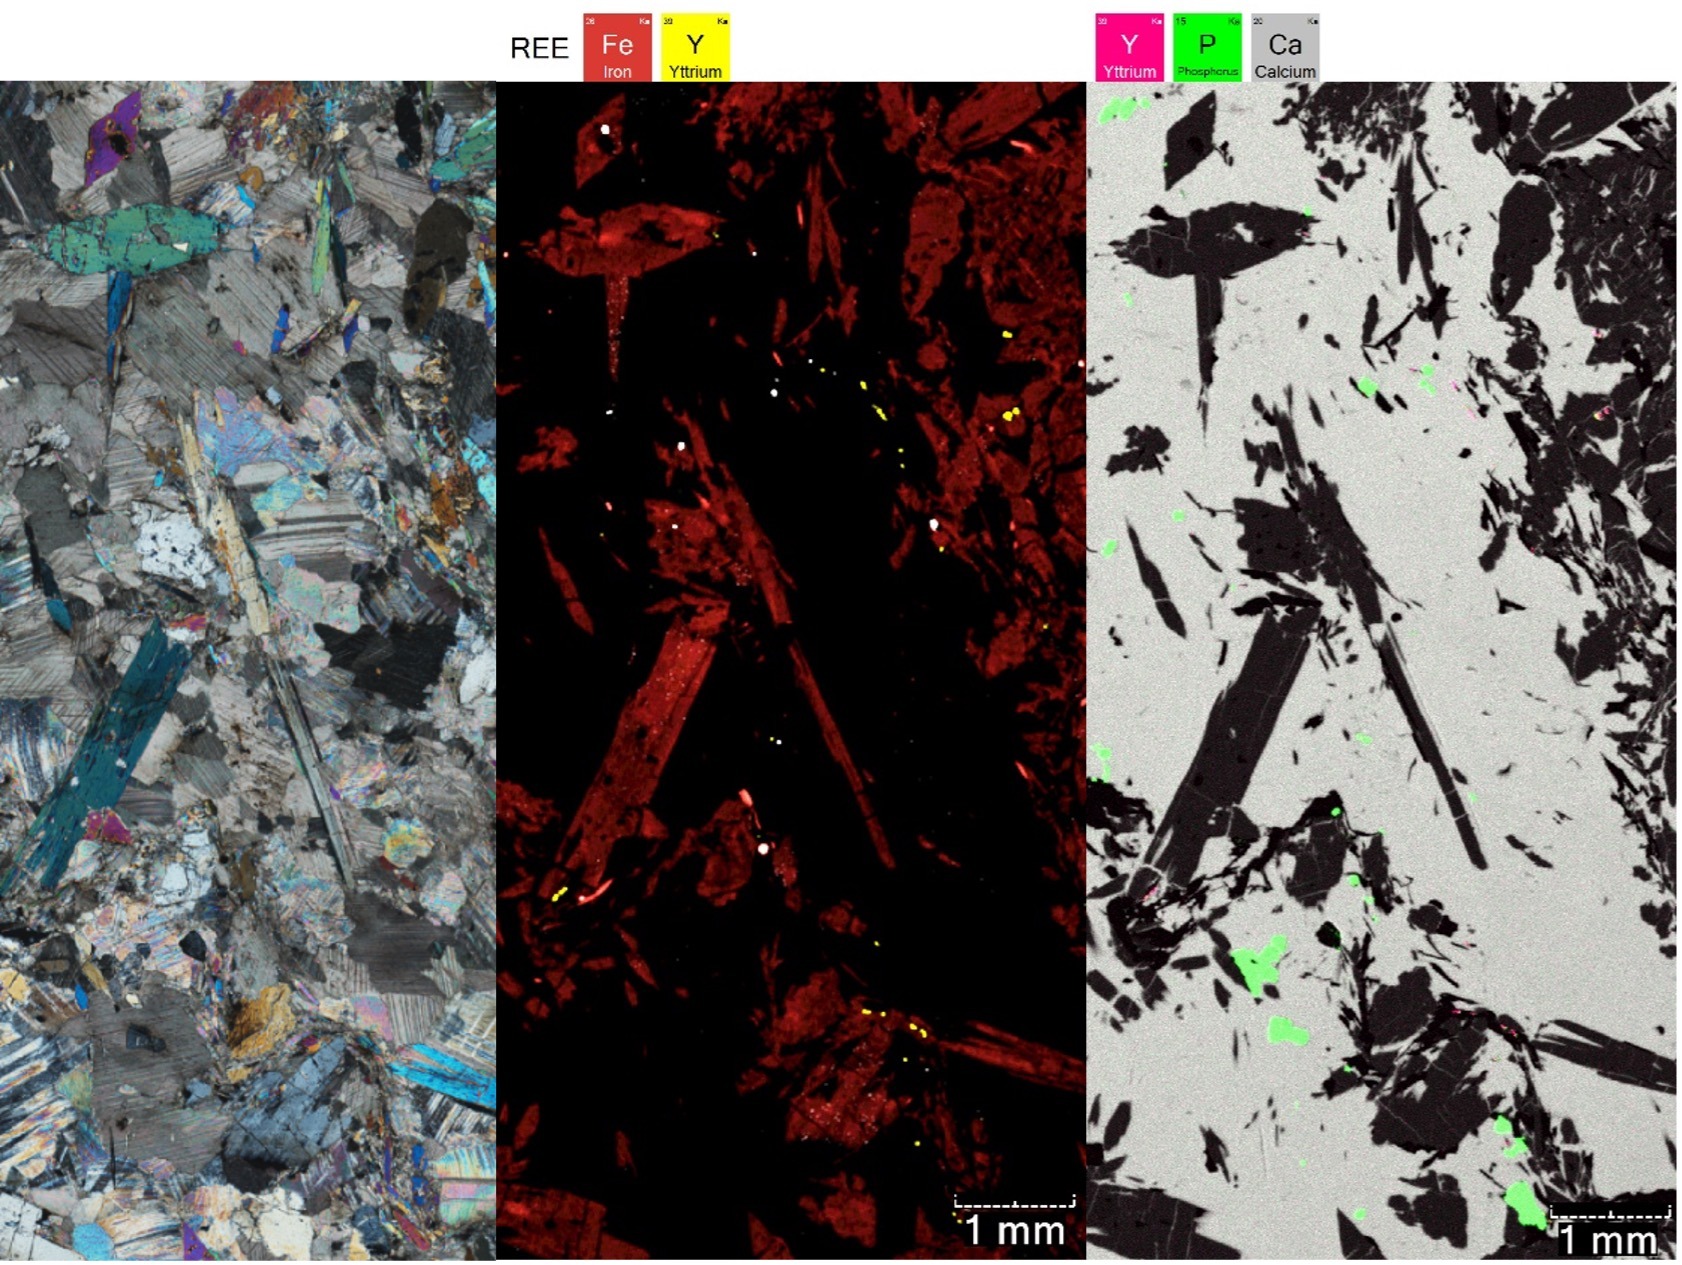
Figure 2. MicroXRF mineral and elemental maps from the Luleå region illustrating Ca–Mg silicates, carbonates, accessory REE phases, and industrially relevant heterogeneity resolved at the mineral scale.
Atlas Apex Capabilities for Critical Minerals & Industry
Built for Complex, Heterogeneous Materials
Geological and industrial samples are rarely uniform. Atlas Apex microXRF is engineered to handle multi-phase, high-density, and chemically complex materials while maintaining quantitative accuracy and mapping efficiency.
Core Capabilities
- ≤10 µm circular excitation spot for distortion-free mineral and phase mapping
- Multi-SDD detector architecture (up to 4) for enhanced trace-element sensitivity
- Large sample chamber supporting thin sections, polished mounts, drill chips, hand samples, slabs, and cores
- Non-destructive analysis preserving irreplaceable or process-critical materials
- High-speed mapping for large-area surveys, linescans, and industrial throughput
Mineral & Phase Quantification
- Light-element performance under vacuum (C, O, Na, Mg, Al, Si)
- Mineral and phase recognition tools using reference databases
- QUANTMAP pixel quantification converting maps into quantitative chemistry for geology, metallurgy, and QA/QC
Where Atlas Apex Is Used
Geological, Environmental & Industrial Systems
Atlas Apex supports mineral-scale analysis across:
- USGS critical mineral systems (Ni, Cr, Co, REEs, P, Ti, PGEs)
- Ultramafic and layered mafic intrusions
- Porphyry, epithermal, and skarn systems
- Metasomatic carbonate–silicate contacts
- Mine tailings and beneficiation products
- Cement, clinker, SCMs, refractories, and ceramics
- Slags, process residues, and industrial by-products
This versatility makes Atlas Apex suitable for government labs, mining companies, processing facilities, shared research centers, and industrial QA/QC labs.
Application Deep Dive — Critical Minerals & Industrial Relevance
From Occurrence to Process Behavior
Atlas Apex enables users to move beyond bulk assays by mapping critical metals and industrial elements directly within mineral and phase hosts—supporting both resource evaluation and process optimization.
Representative Use Cases
- REE and critical metal phase association
- Locked vs liberated metal identification
- Alteration and reaction zoning
- Feedstock and concentrate characterization
- Processing, recovery, and performance optimization
Featured Case Study
Ultramafic Oxide–Apatite Peridotite Systems
Mineral-Scale Mapping of Critical Minerals in Ultramafic Rocks
In oxide–apatite peridotite cores, Atlas Apex resolves the spatial distribution and mineral associations of Ni, Cr, Ti, Fe, and P across centimeter-to-decimeter scales—linking bulk critical mineral inventories to specific mineral hosts such as olivine, Fe–Ti oxides, and apatite. This insight is critical for resource characterization, beneficiation strategy, and downstream processing decisions.
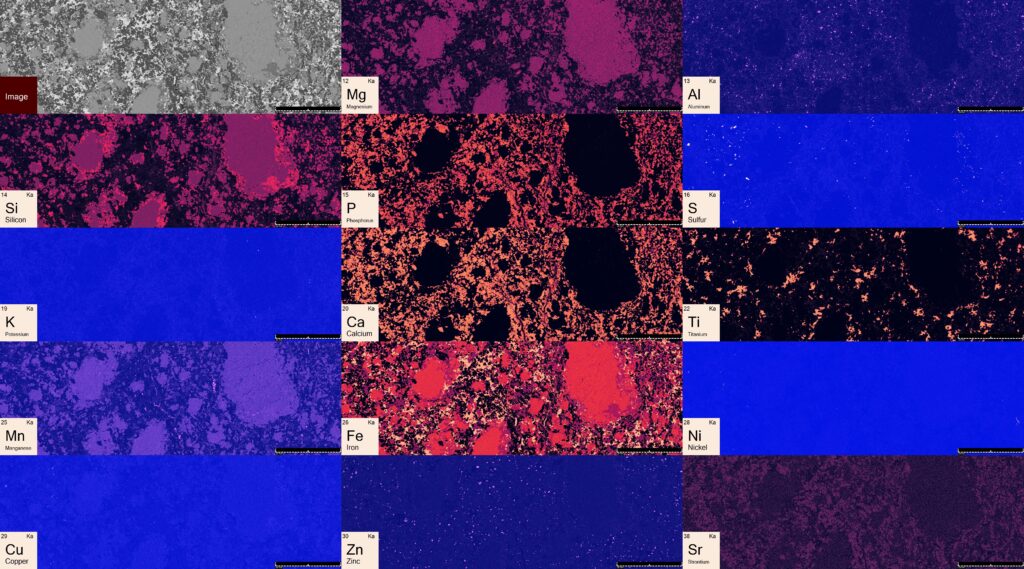
Figure 3. MicroXRF elemental and mineral-phase maps of an oxide–apatite peridotite core collected with the Atlas Apex microXRF. Above is a large-area elemental map (Mg, Al, Si, P, Ca, Ti, Mn, Fe, Ni, Cu, Zn, Sr) illustrating the heterogeneous distribution of major, minor, and critical elements across the peridotite core, providing a continuous geochemical context at the hand-sample scale.
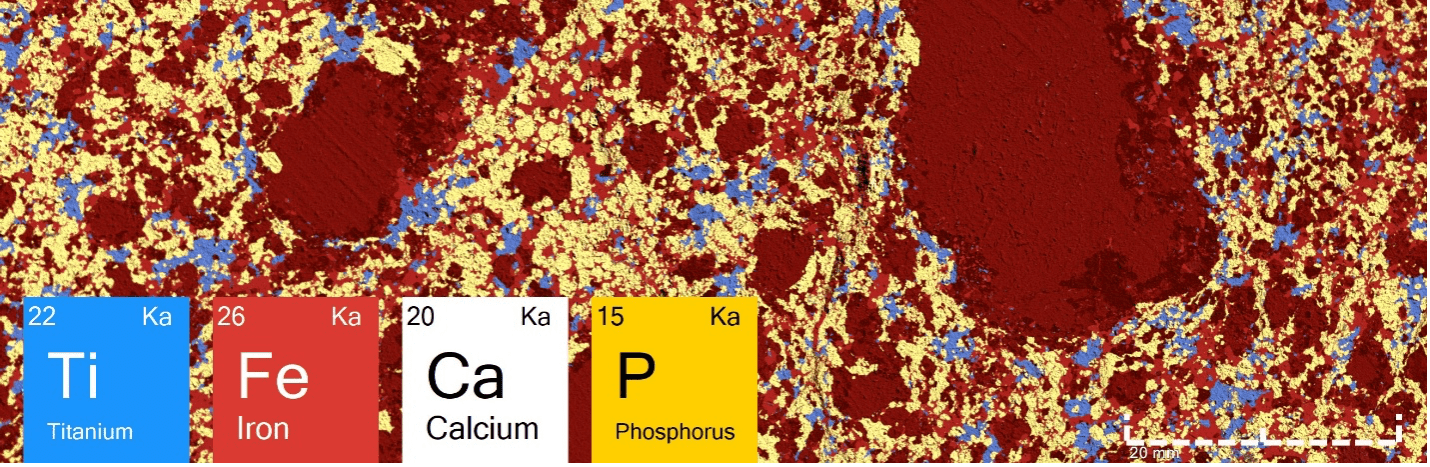
Figure 4. Composite elemental overlays of Ti, Fe, Ca, and P highlight the spatial relationship between Fe–Ti oxides and apatite, constraining the distribution of critical minerals and accessory phosphate phases relevant to resource evaluation.
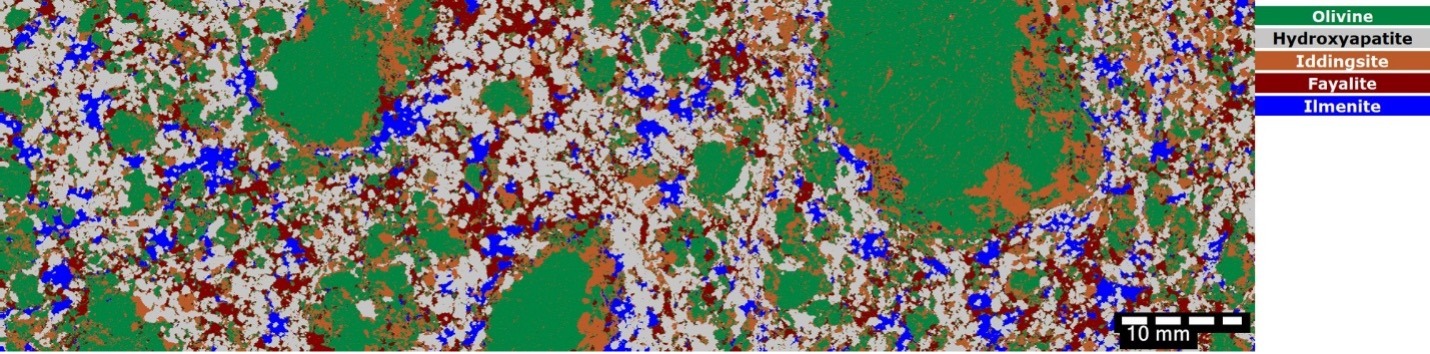
Figure 5. Automated mineral-phase classification map identifies olivine, fayalite, iddingsite, ilmenite, and hydroxyapatite, linking elemental zonation to specific mineral hosts.
USGS Critical Minerals Resolved
- Nickel (Ni): Zoned within olivine and Fe-rich alteration phases
- Chromium (Cr): Concentrated in oxide-bearing domains
- Titanium (Ti): Hosted in Fe–Ti oxides (e.g., ilmenite)
- Phosphorus (P): Localized in apatite and accessory phosphates
Geological & Industrial Case Studies
Proven in Research, Exploration & Processing
- Epithermal Gold: Mineral-scale Au deportment for recovery optimization
- REE Systems: Monazite, xenotime, and apatite discrimination
- Intrusion Contacts: Fe–Mg metasomatism and transport length scales
- Porphyry Systems: Alteration mapping for exploration and processing
- Nickel Systems: Large-area Ni zonation beyond SEM-EDS
- Carbonate–Silicate Materials: Phase heterogeneity relevant to cement and industrial performance
Representative Figures
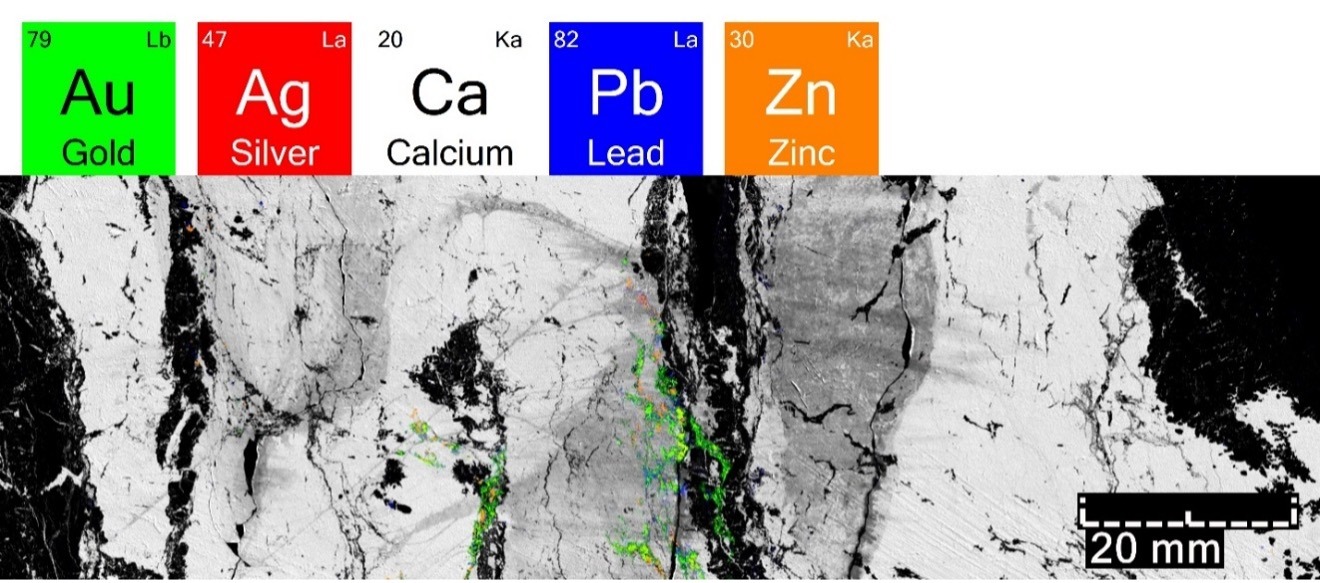
Figure 6. MicroXRF elemental map of bonanza-grade gold mineralization (>100 g/t Au) from the Brucejack deposit, British Columbia. The map shows the spatial distribution of Au and associated pathfinder elements (Ag, Pb, Zn), enabling evaluation of gold deportment as free gold, micro-inclusions, or electrum associated with sulfides. Mineral-scale associations and alteration patterns provide insight into overprinting mineralizing events and support exploration, sampling, and processing optimization.
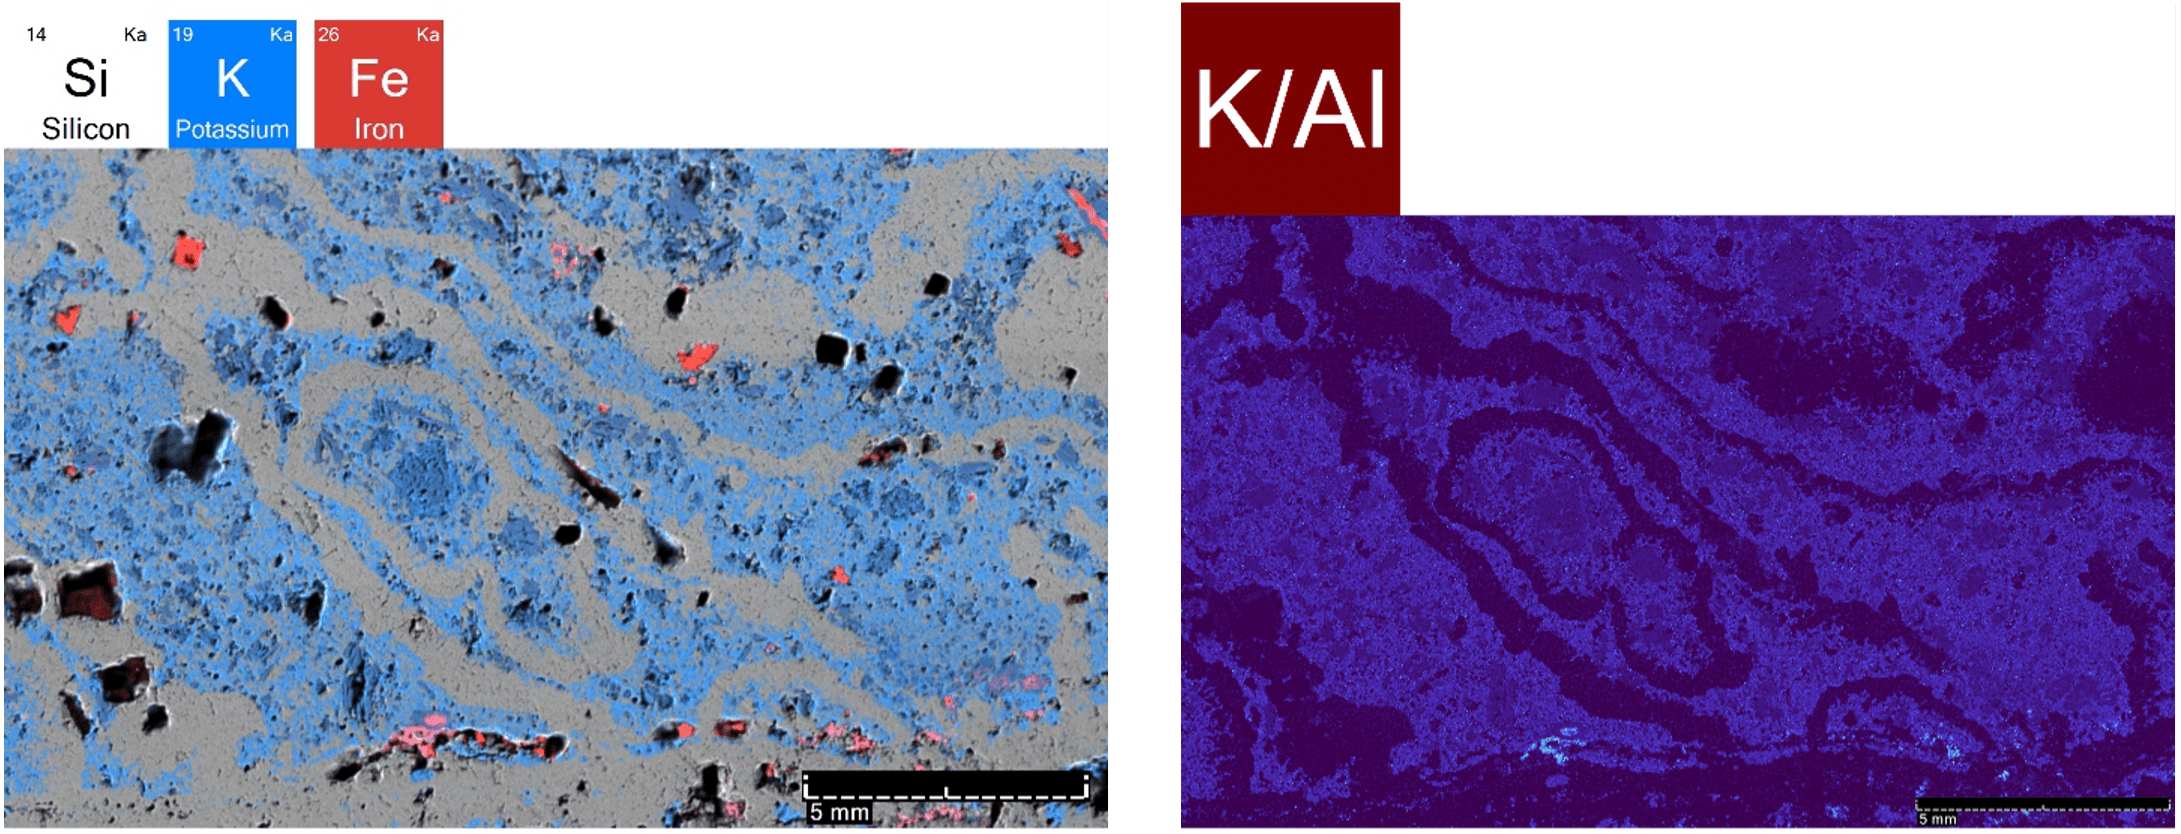
Figure 7. MicroXRF elemental map of a porphyritic intrusion from the Red Hills porphyry system, Philipsburg District, Montana. The map highlights wormy quartz veins (Si-rich) formed from volatile-rich magmatic fluids during the transition from magmatic to hydrothermal conditions, with remnant groundmass textures preserved between veins. Elemental distributions of K, Al, and Fe delineate feldspar- and mica-bearing domains within the host intrusion, recording fluid movement and alteration pathways. Variations in K/Al ratios distinguish primary K-feldspar from hydrothermal muscovite, providing mineral-scale evidence for alteration processes associated with porphyry-style ore formation.
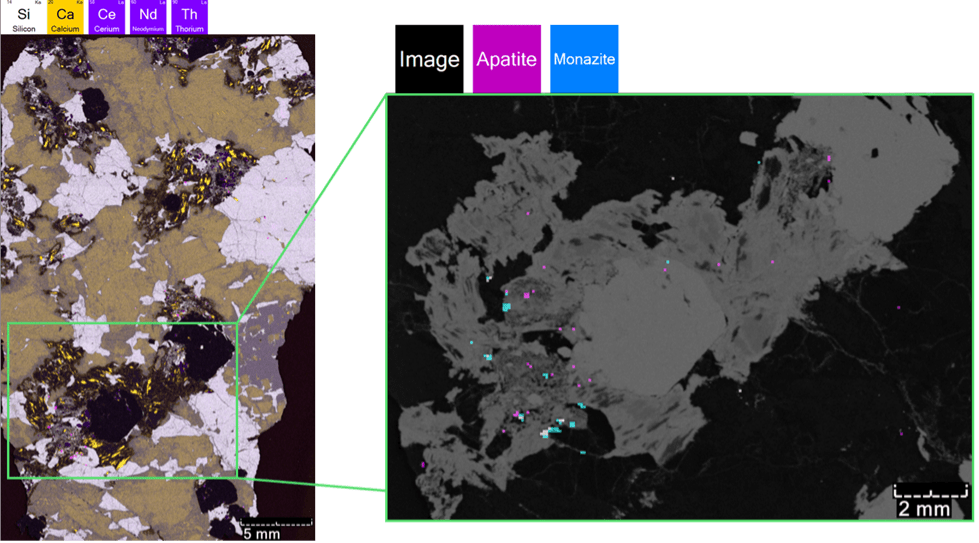
Figure 8. MicroXRF elemental and mineral-phase maps highlighting REE phosphate minerals in a UBC sample. These microXRF maps resolve the spatial distribution of light rare earth elements (LREEs; Ce, La) and associated elements used to distinguish monazite from compositionally similar phosphate phases. Elemental correlations identify monazite as the primary LREE repository, enriched in Ce and La and accommodating U and Th within its crystal structure, making it a key mineral for geochronology via radiogenic Pb. In contrast, apatite (Ca phosphate) and xenotime (YPO₄) are differentiated by their Ca- and Y-rich signatures, respectively. The maps demonstrate the ability of microXRF to discriminate overlapping REE-bearing phases and to locate monazite grains for targeted geochronologic and petrogenetic analysis.
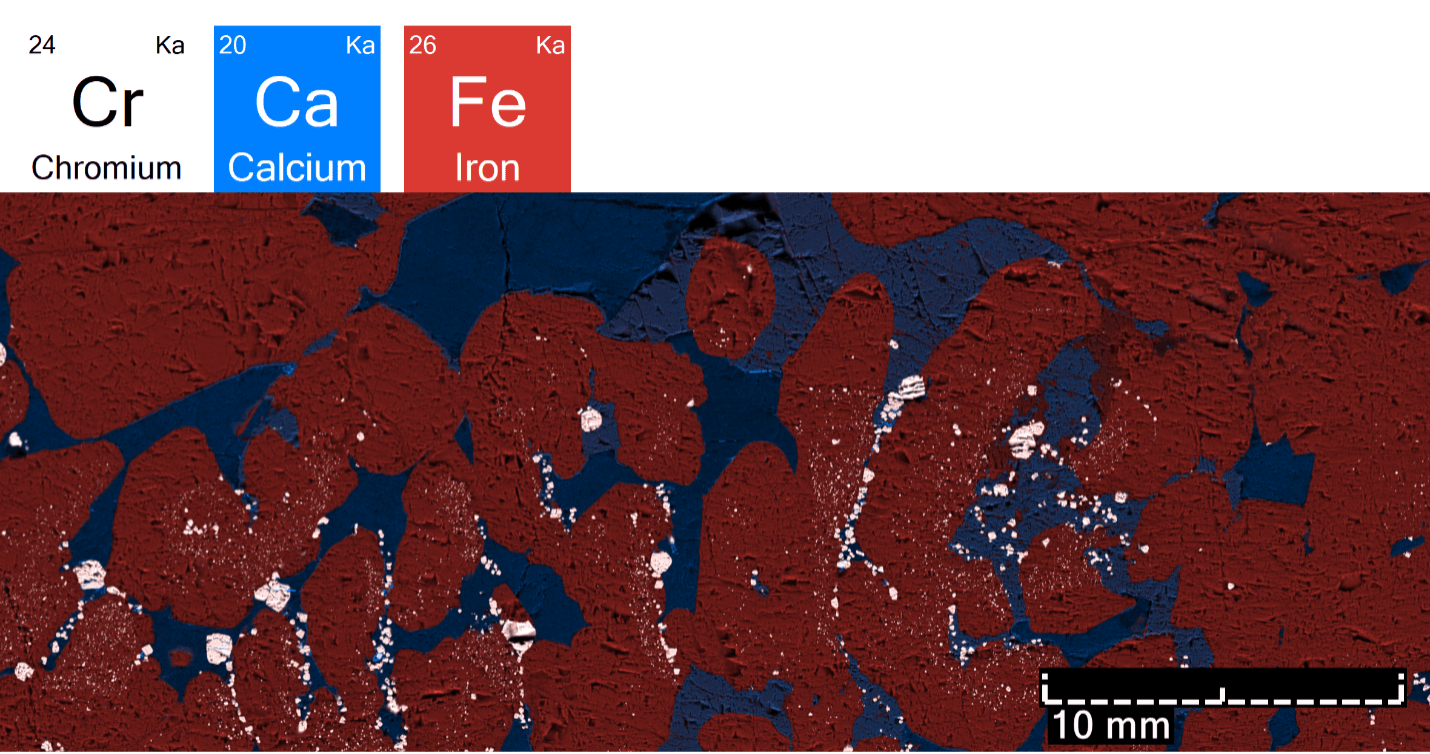
Figure 9. MicroXRF elemental map of a chromium-bearing sample from the Stillwater Complex, Montana. This microXRF map shows the spatial distribution of Cr relative to major elements (e.g., Fe, Ca) within a large slab from the Stillwater Complex—the largest domestic source of chromium in the United States. Mineral-scale Cr heterogeneity highlights chromite-rich domains and their textural relationships within the host lithology, providing insight into critical mineral occurrence and distribution. The map demonstrates the value of microXRF for non-destructive characterization of Cr-bearing materials relevant to resource evaluation and renewed exploration interest.
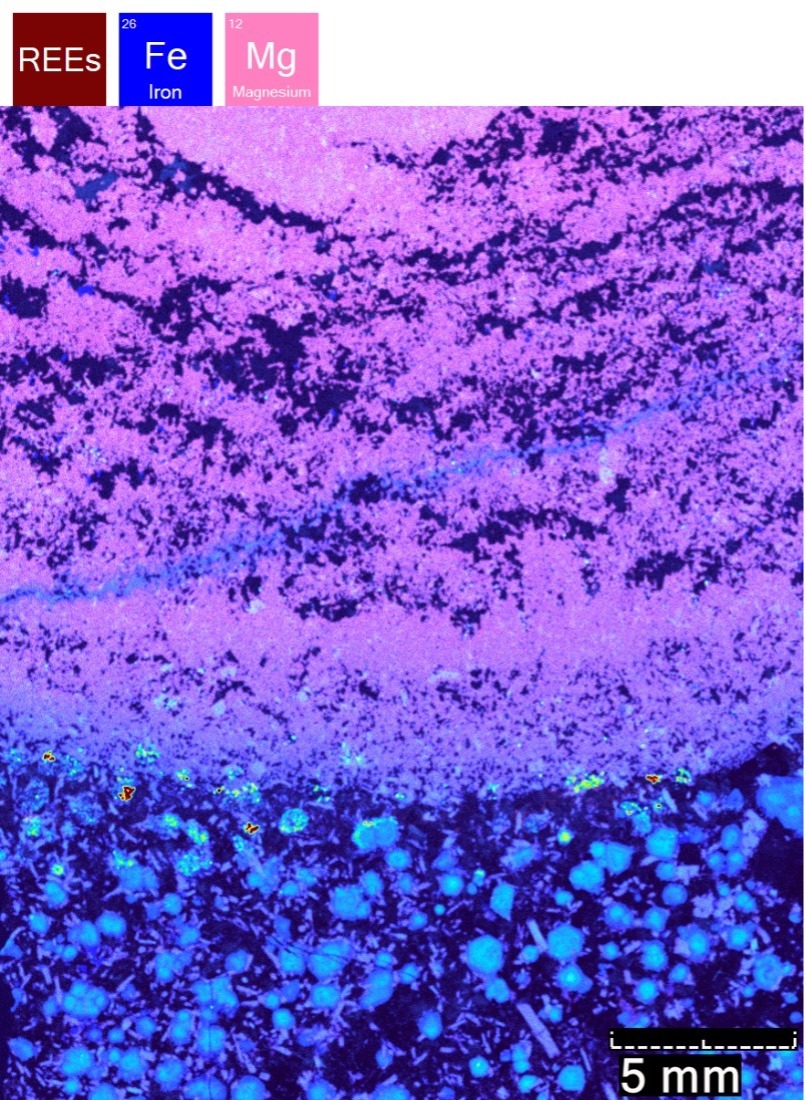
Figure 10. MicroXRF elemental and ratio map across the syenite–marble contact (LQ09), northwest Scotland. The map shows Fe–Mg metasomatism associated with intrusion of an Fe- and K-rich syenite into Ca–Mg-rich marble, with XMg = Mg/(Mg+Fe) in phlogopite recording decreasing Fe influence with distance from the contact. Trace REE enrichments localized at the lithological transition indicate fluid-assisted transport and concentration during metasomatism, providing constraints on cation-transport length scales and on intrusion-related fluid–rock interaction.
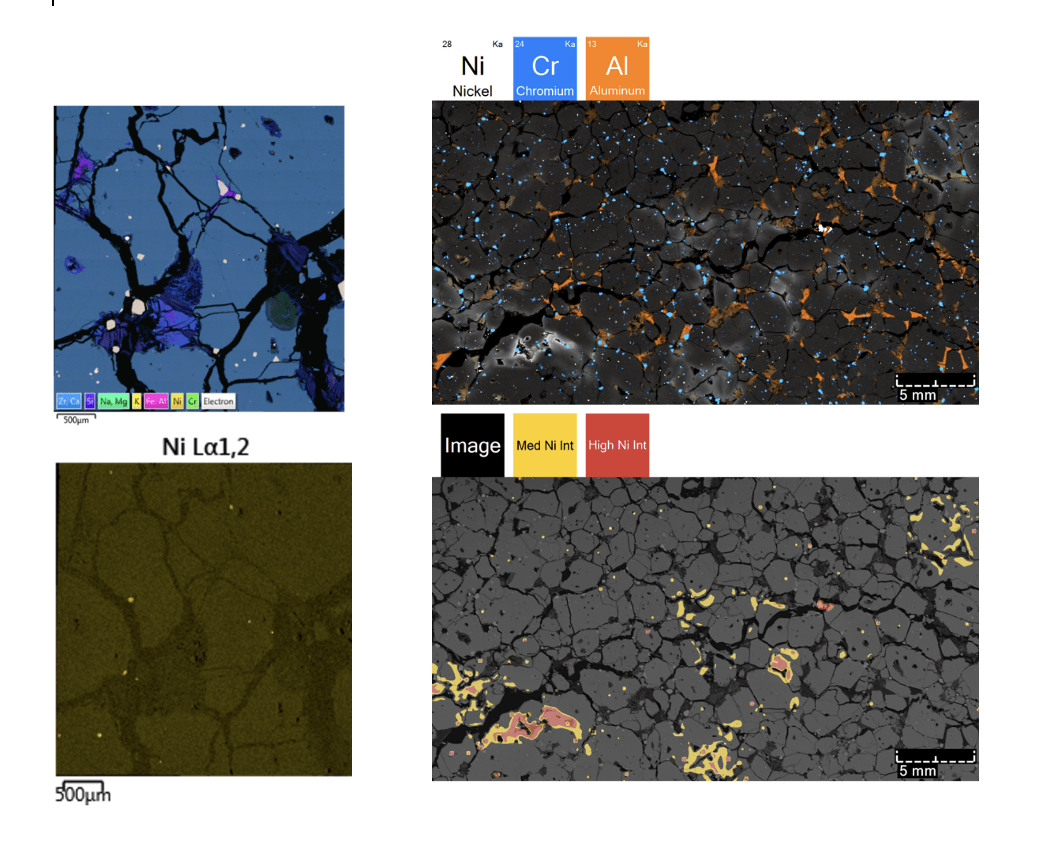
Figure 11. Comparison of SEM-EDS and microXRF mapping of nickel zonation in Tamarack sample. These maps compare conventional SEM-EDS (top left and bottom left) analysis with microXRF elemental mapping (top right and bottom right) to evaluate Ni zonation and distribution within a Ni-bearing sulfide assemblage from the Tamarack system. While SEM-EDS resolves Ni at localized, micron-scale fields of view, microXRF provides continuous, large-area context, revealing systematic Ni variations relative to Cr, Al, and associated phases across the sample. The microXRF maps capture broader zonation patterns and compositional gradients that are difficult to recognize from point or small-area EDS alone, demonstrating the value of microXRF as a complementary technique for assessing nickel deportment, mineral associations, and magmatic or metasomatic processes in Ni-rich systems.
Typical Geology & Industry Workflow with Atlas Apex
- Mount sample (thin section, chip, slab, polished block, or core)
- Acquire optical overview image
- Run fast survey map (~20 minutes)
- Select regions of interest
- Perform high-resolution mapping (5–10 µm)
- Apply mineral/phase classification and QUANTMAP
- Export results for petrography, metallurgy, GIS, or QA/QC reporting
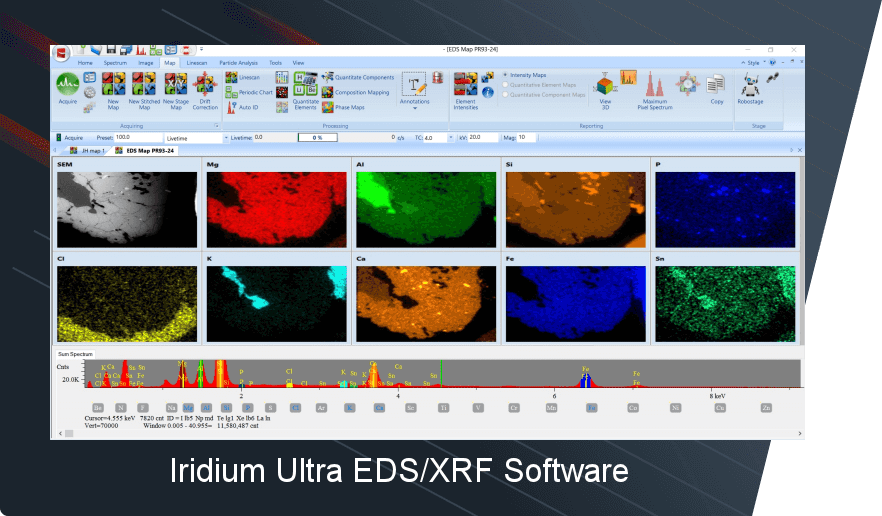
Geology & Industry Software — Iridium Ultra
Tools for Research, Processing & QA/QC
- IU-MAP_ACQUIRE — high-speed elemental mapping
- IU-QUANTMAP — quantitative pixel chemistry
- IU-GEOCHEM — mineral identification
- Automated reporting for publications and quality documentation
Global Support & Delivery
Direct OEM Support for Research & Industry
- Local installation and training
- Multi-region demo availability
- Geological and industrial calibration standards
- Fast shipment from the United States
Get a MicroXRF Demonstration
Whether your focus is critical minerals, mining, industrial materials, cement chemistry, or QA/QC, Atlas Apex delivers mineral-scale insight for confident decisions.
Send Your Sample
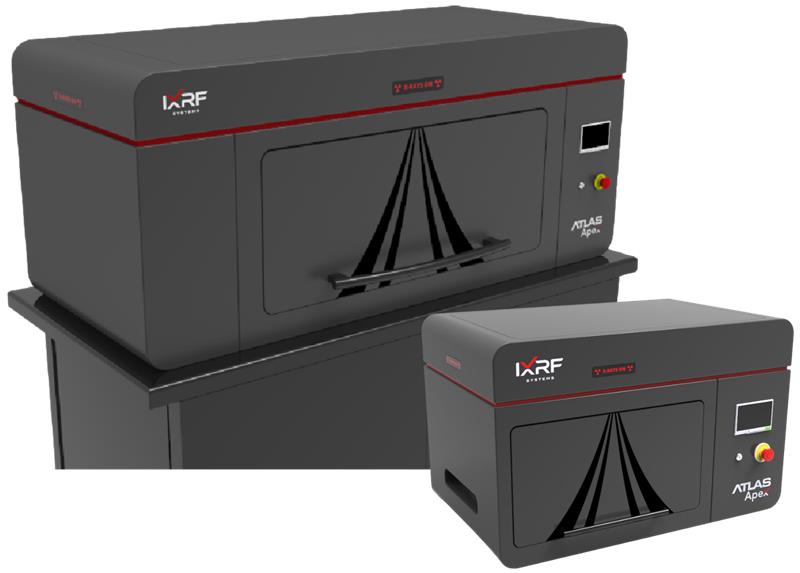
Atlas Apex Family of microXRF
Looking for a Specific Application Note?
Fill out the form to request an application note. We have many that are instantly available and others we will customize to your needs.