High-resolution microXRF elemental mapping, hyperspectral XRF imaging, and quantitative micro-scale analysis for research and industrial laboratories
What is the Atlas Apex M?
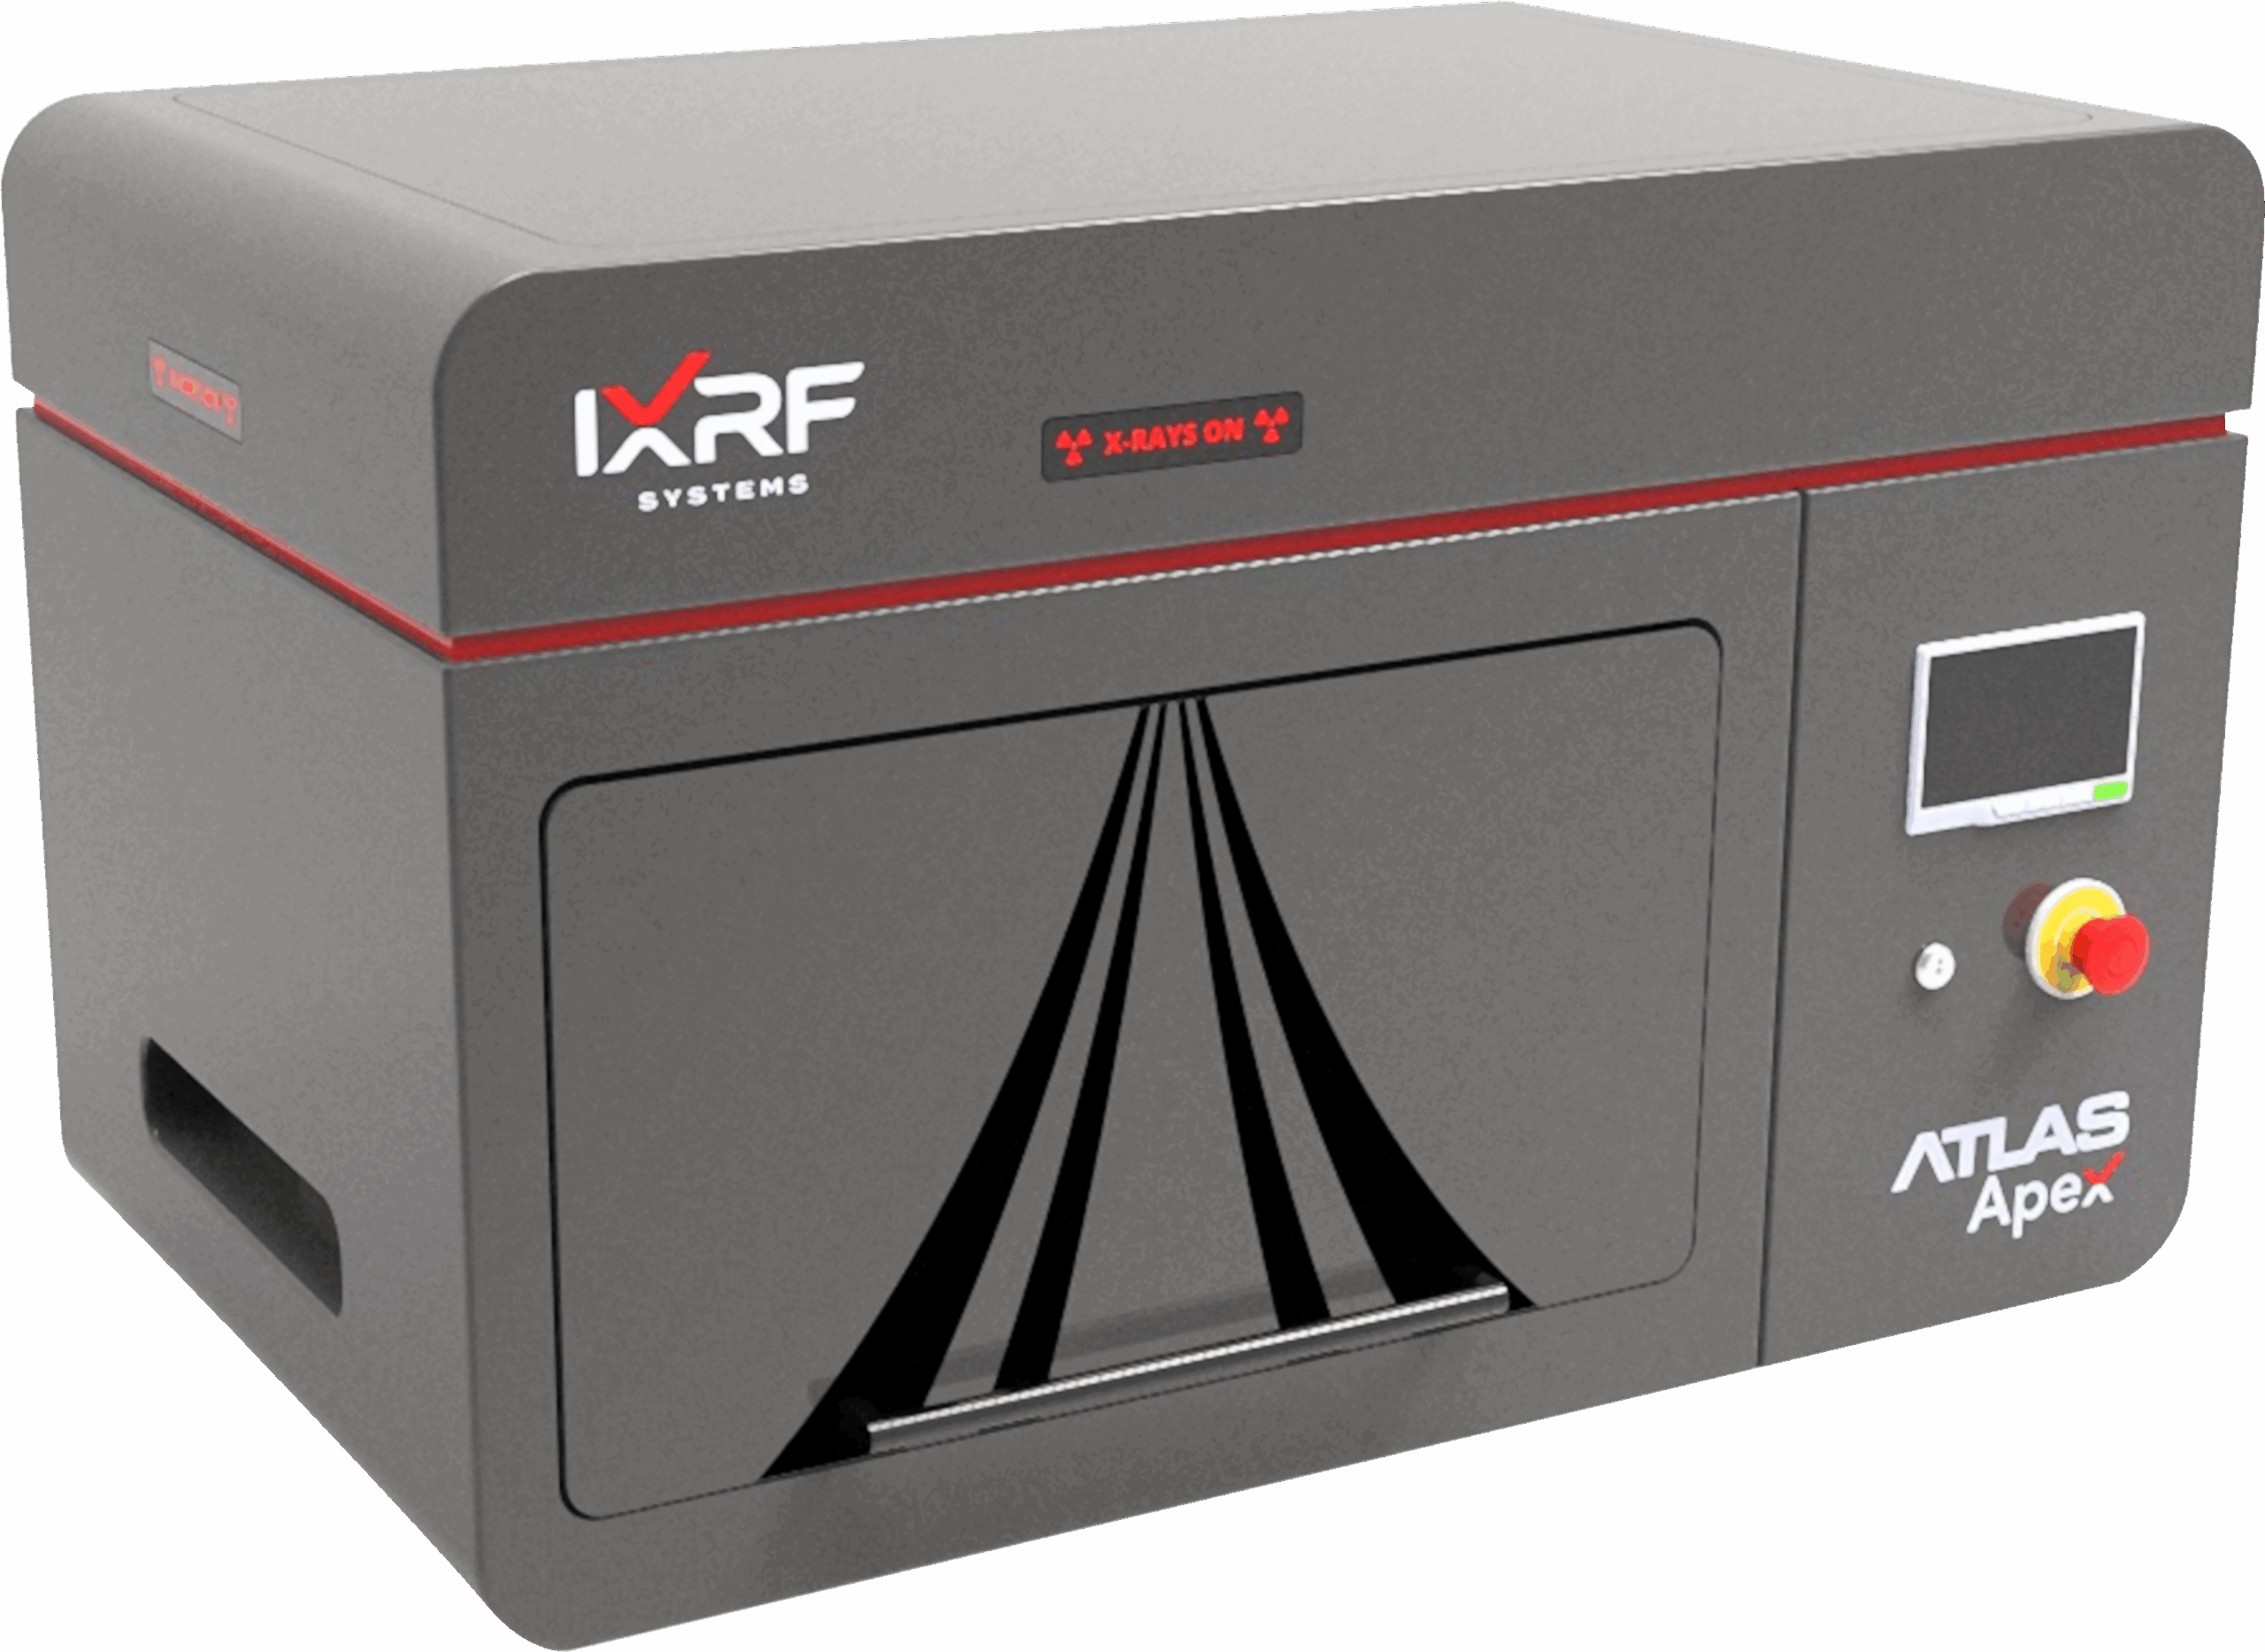
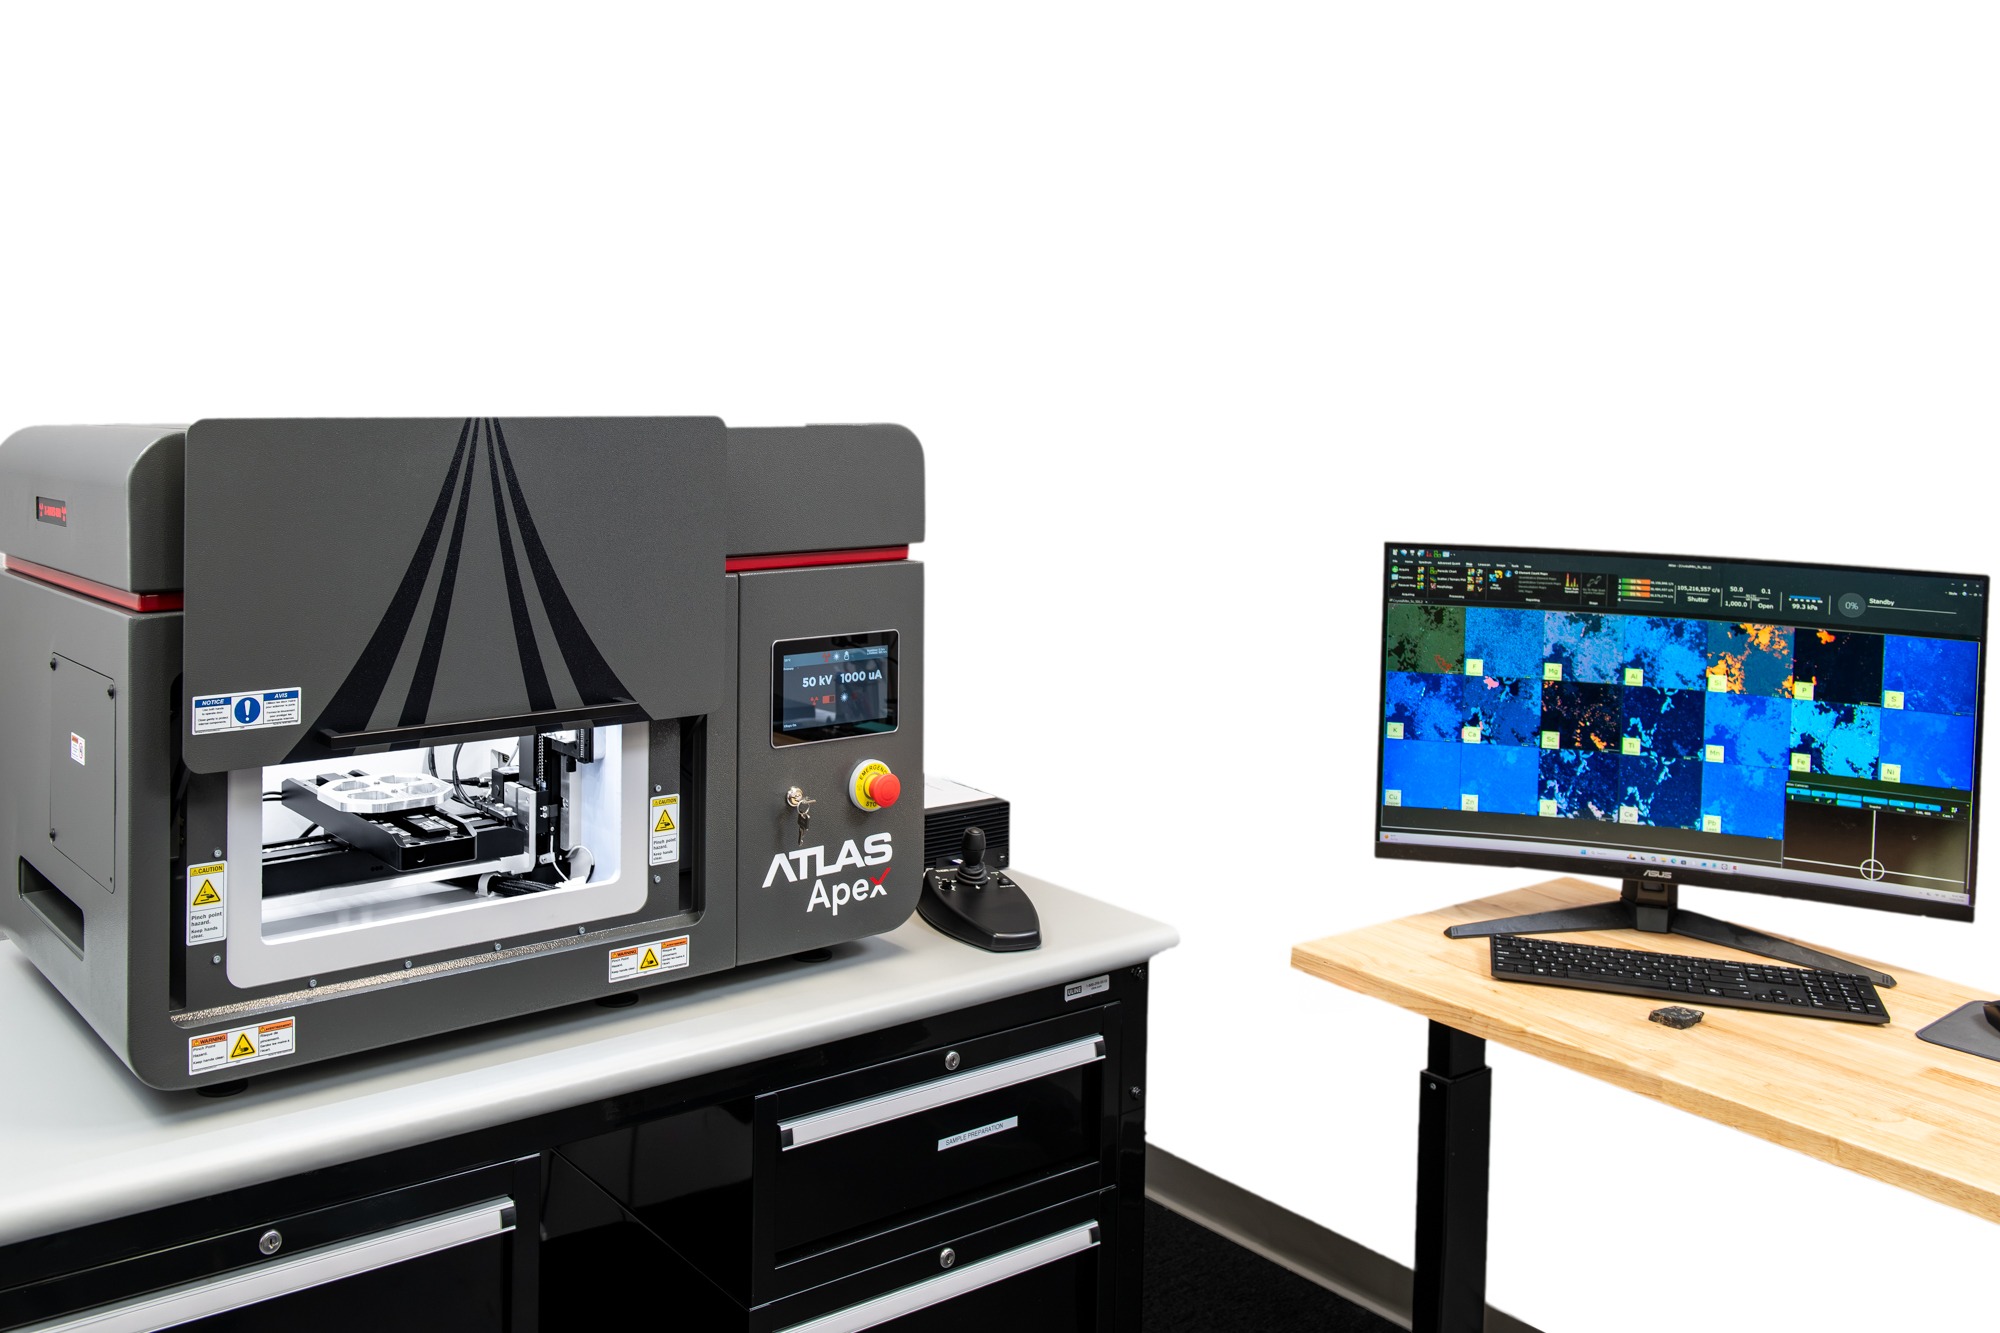
The Atlas Apex M is a benchtop microXRF spectrometer designed for non-destructive elemental mapping, hyperspectral XRF imaging, and quantitative micro-scale analysis. It combines a microfocus X-ray source and polycapillary focusing optics with perpendicular excitation geometry, up to four SDD detectors, automated XYZ positioning, and Iridium Ultra software. Configurations provide X-ray spot sizes down to 5 µm for analyzing solids, powders, particles, liquids, thin films, coatings, geological materials, electronics, and other complex samples.
Micro X-ray fluorescence (µXRF, µEDXRF, micro-XRF, microEDXRF) spectroscopy is an elemental analysis technique that relies on the same principles as X-ray fluorescence (XRF) spectrometry. The difference is that micro X-ray fluorescence (microEDXRF) spectrometry has a spatial resolution many orders of magnitude smaller than conventional XRF, WDXRF, or EDXRF spectrometers. Practically, microEDXRF spectrometers with high-precision scanning XYZ-stages — like the Atlas Apex series — function as a type of XRF hyperspectral imaging microscope, where each pixel (in a map or image) contains information from 0.2 – 40 keV in the electromagnetic spectrum.
While restricting the X-ray beam with a pinhole aperture can achieve a smaller excitation spot, this method blocks much of the X-ray flux, which adversely affects the sensitivity of trace elemental analysis. Modern polycapillary focusing X-ray optics can create small focal spots of just a few micrometers in diameter. Using such X-ray optics, the IXRF Systems’ Atlas Apex series of imaging spectrometers provides a tiny focal spot (down to 5 μm, depending on desired configuration) that is much more intense, enabling enhanced trace element analysis and the creation of hyperspectral images of a sample. Micro X-ray fluorescence (μXRF) spectrometry is commonly used in applications such as botany, cement, forensics, small-feature evaluations, elemental mapping, mineralogy, metals & alloys, electronics, multi-layered coating analysis, micro-contamination detection, film and plating thickness, biology, and the environment.
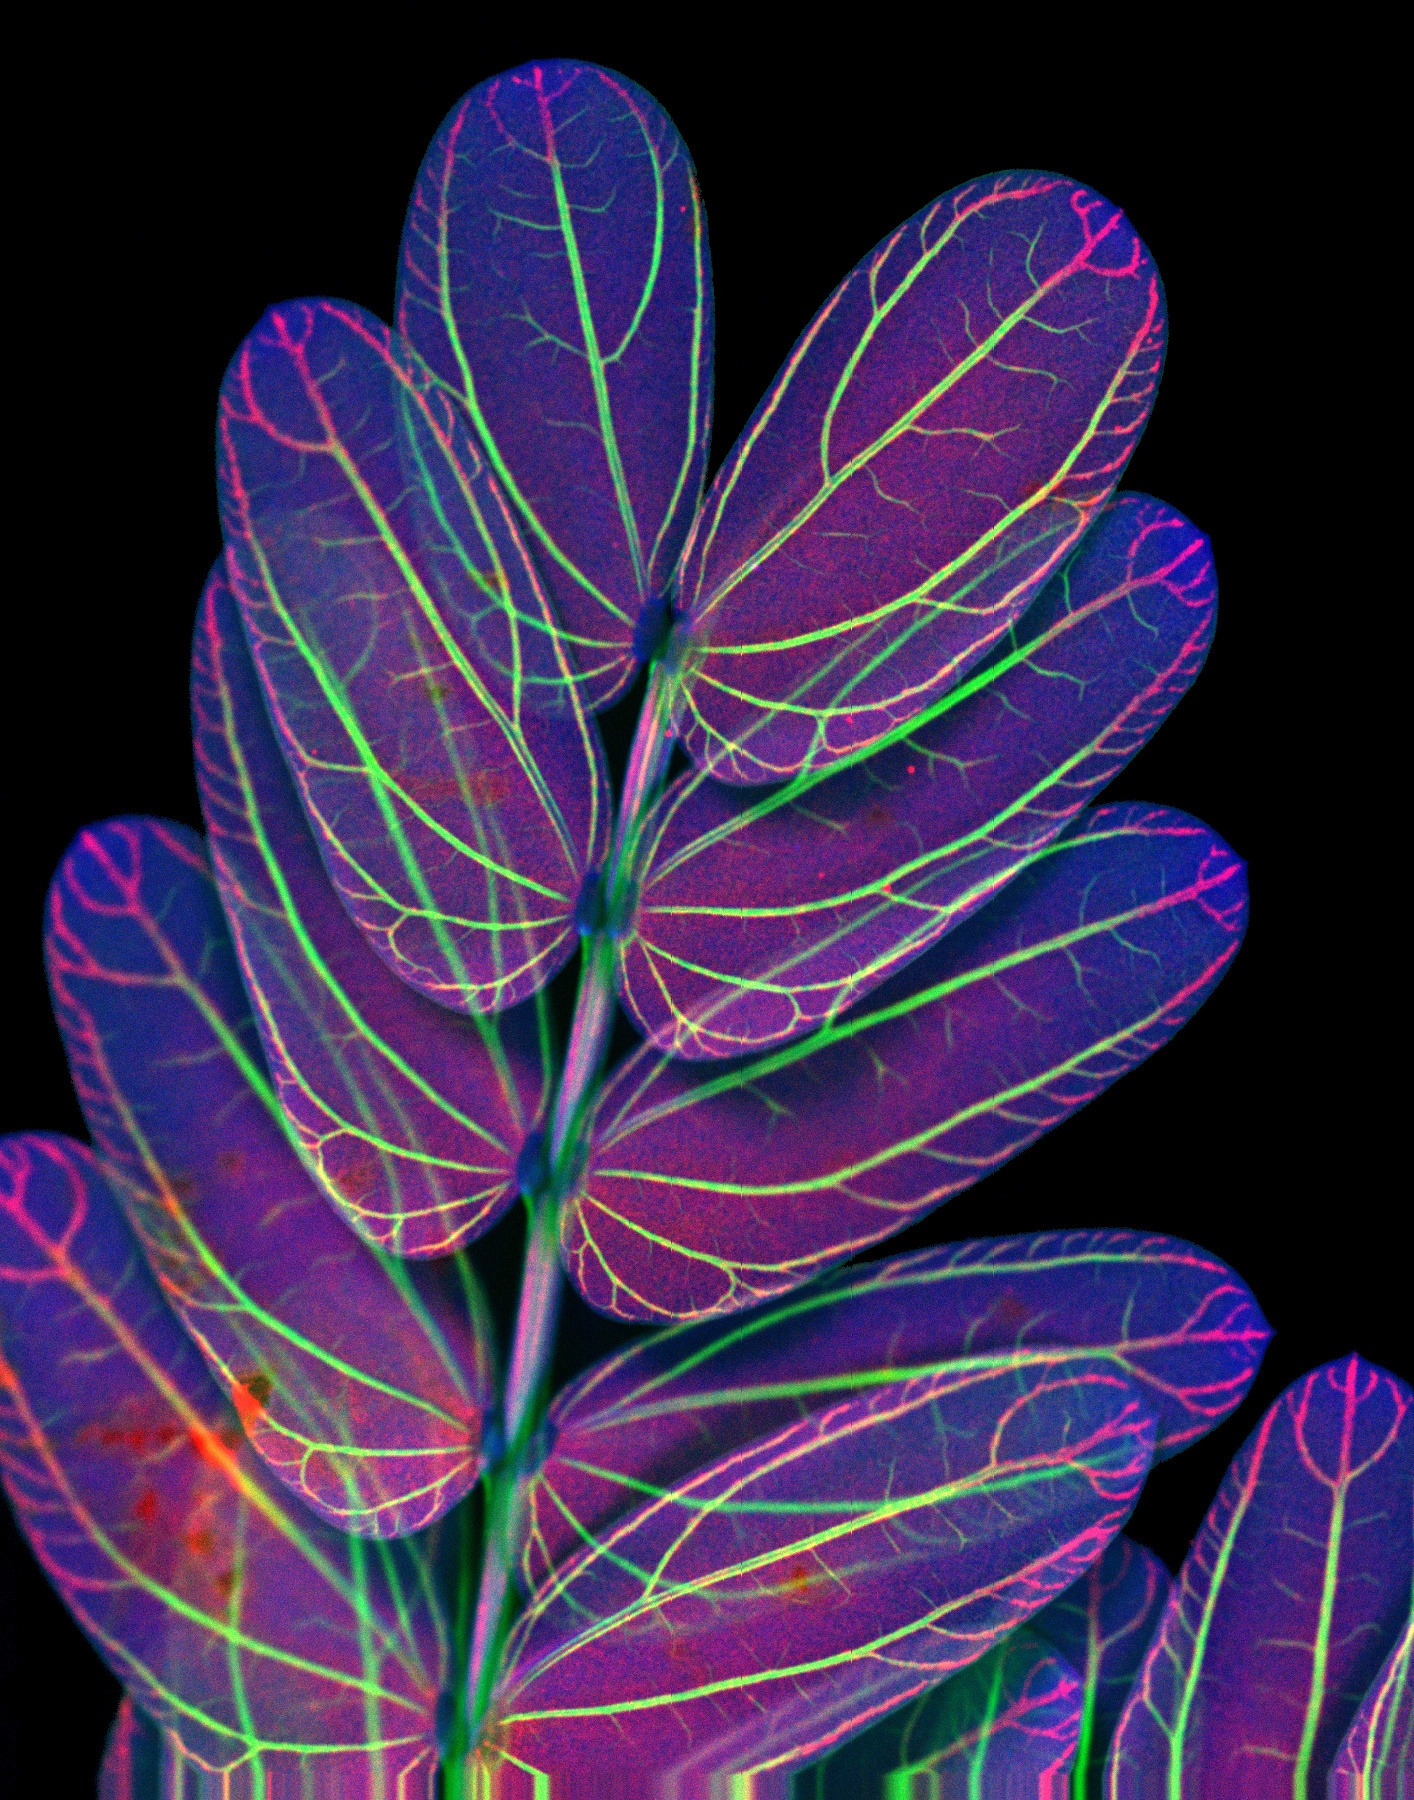
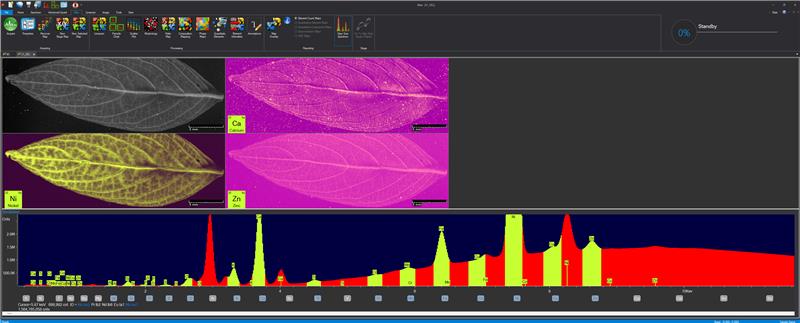
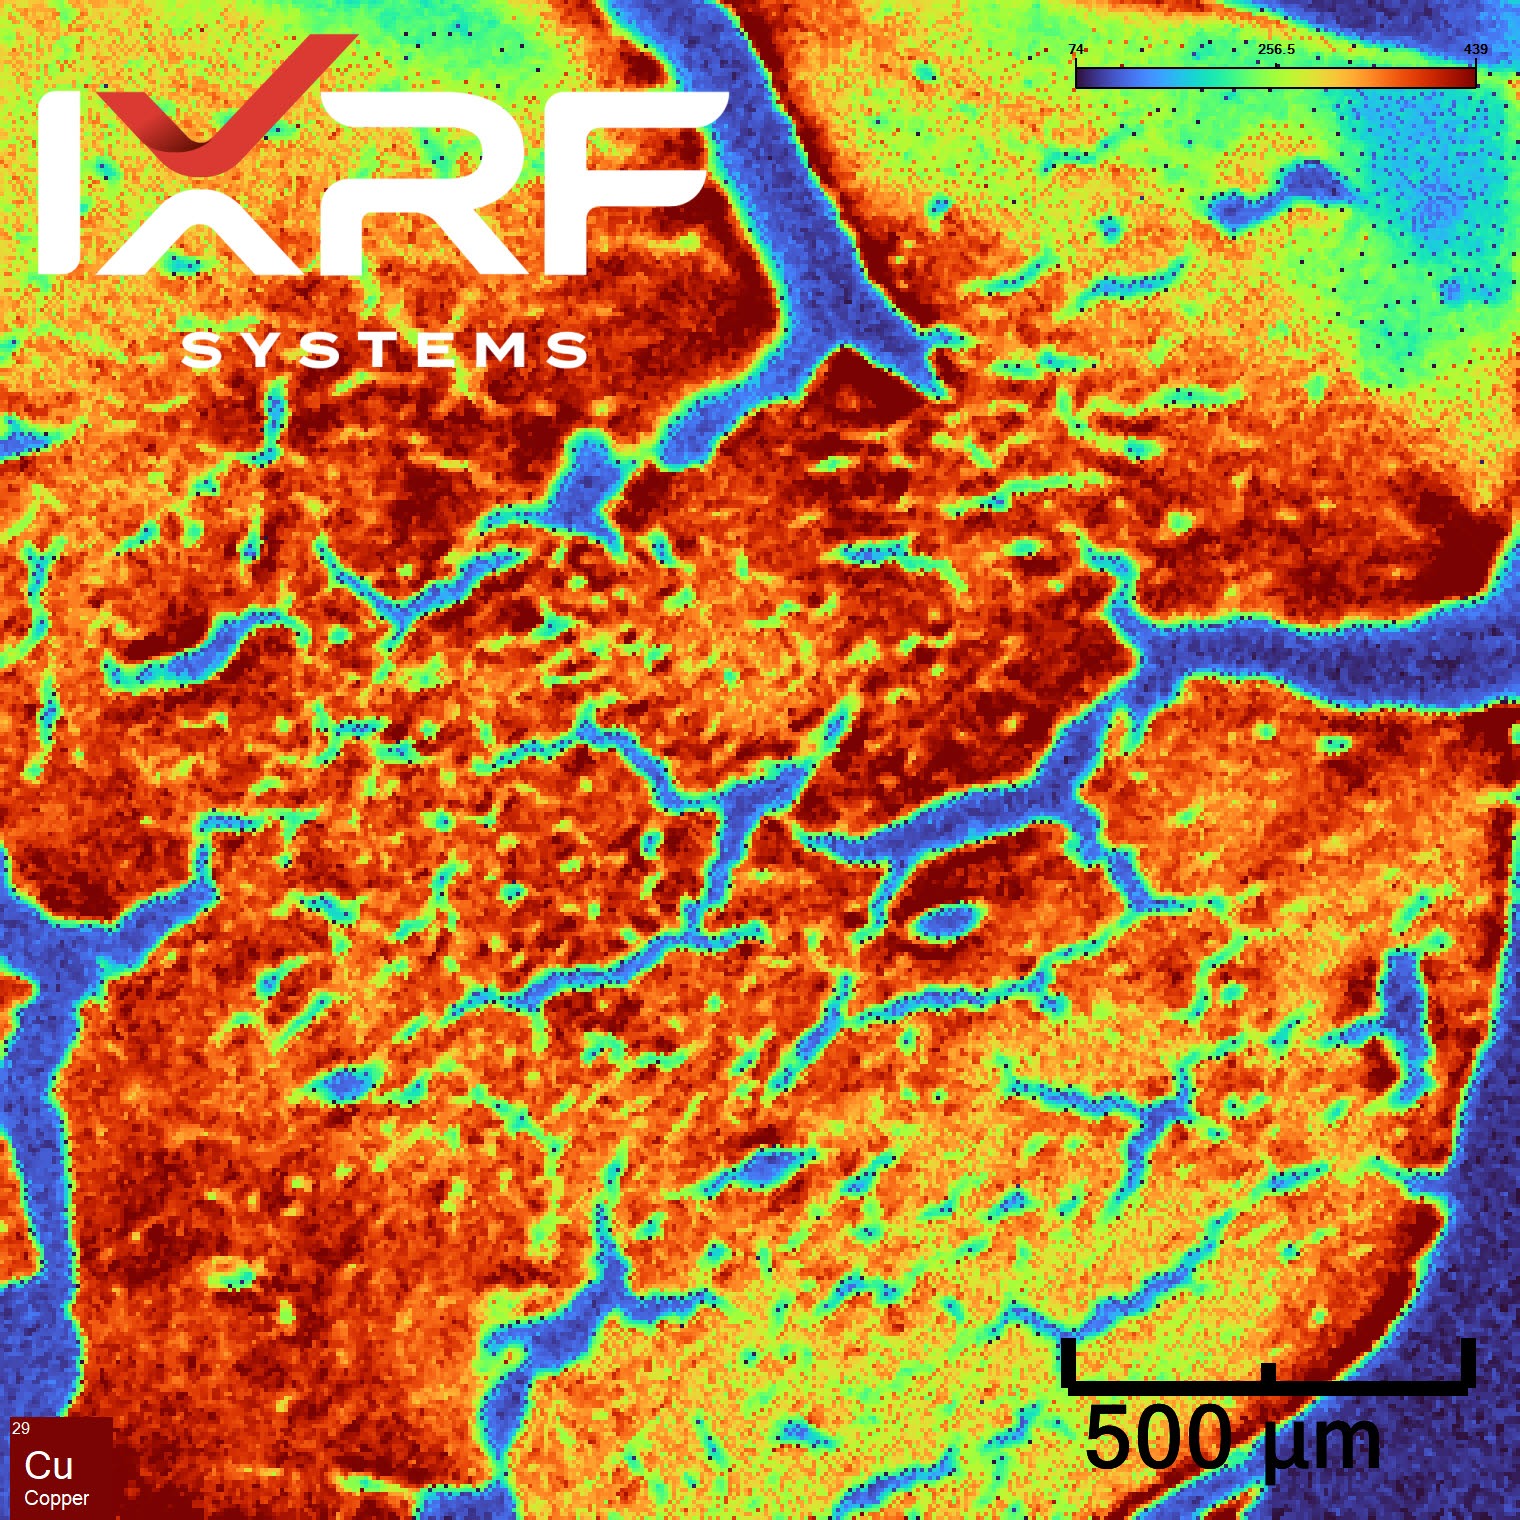
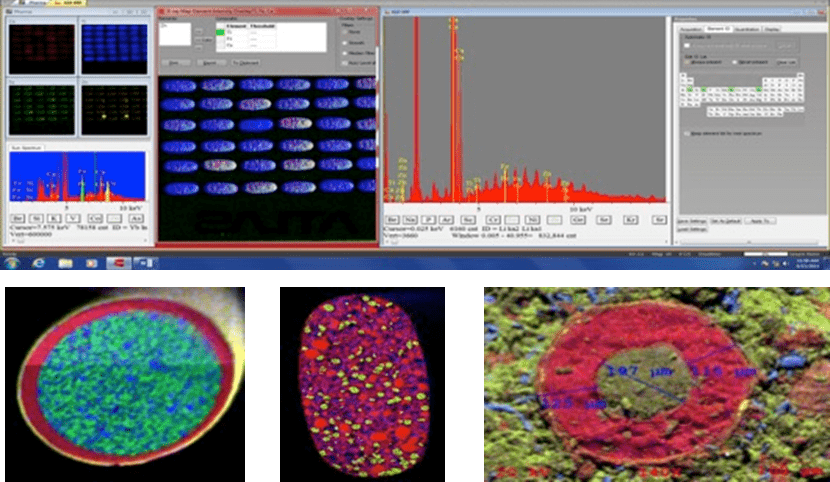
Atlas Apex microXRF elemental maps of K, Ca, Se and sum of X-rays image of a hydrated youngest fully opened leaflet of Neptunia amplexicaulis (CLICK to ENLARGE)
What Makes Atlas Apex M Different from Conventional µXRF?
Atlas Apex M is a benchtop microXRF spectrometer designed for high-resolution elemental mapping, hyperspectral XRF imaging, and quantitative micro-scale analysis. Its 5 µm X-ray spot enables detailed chemical imaging, allowing users to resolve fine features, identify localized elemental variations, and characterize complex materials with exceptional spatial accuracy.
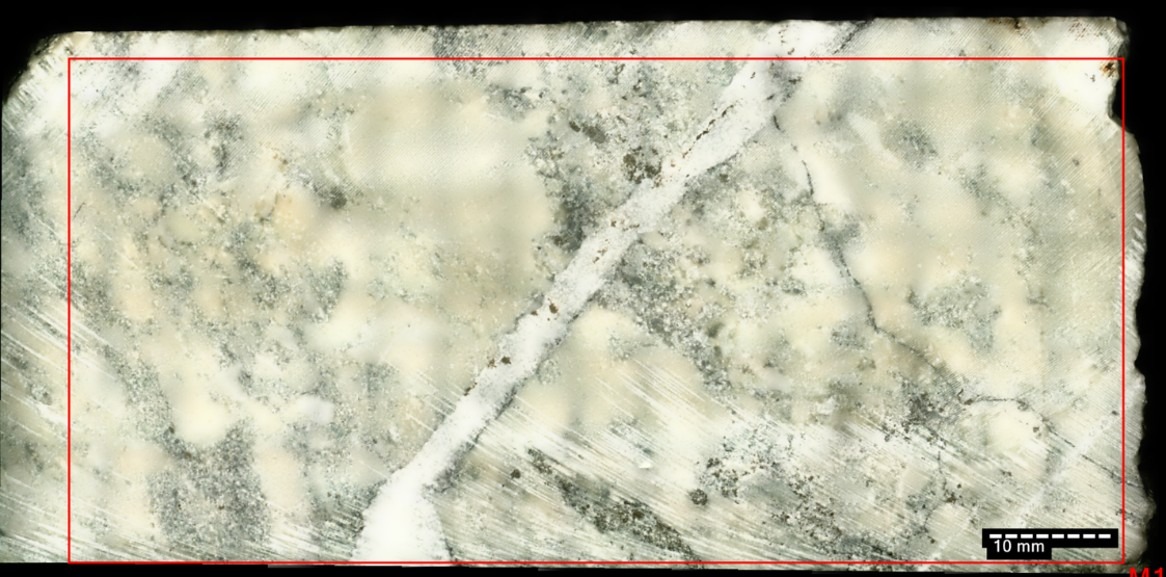
This high-resolution capability is especially valuable for applications such as geological thin sections, mineral mapping, contamination analysis, coatings, semiconductors, and advanced materials research, where smaller beam sizes reveal finer elemental distributions, sharper phase boundaries, and subtle sample heterogeneity that larger spot sizes may miss.
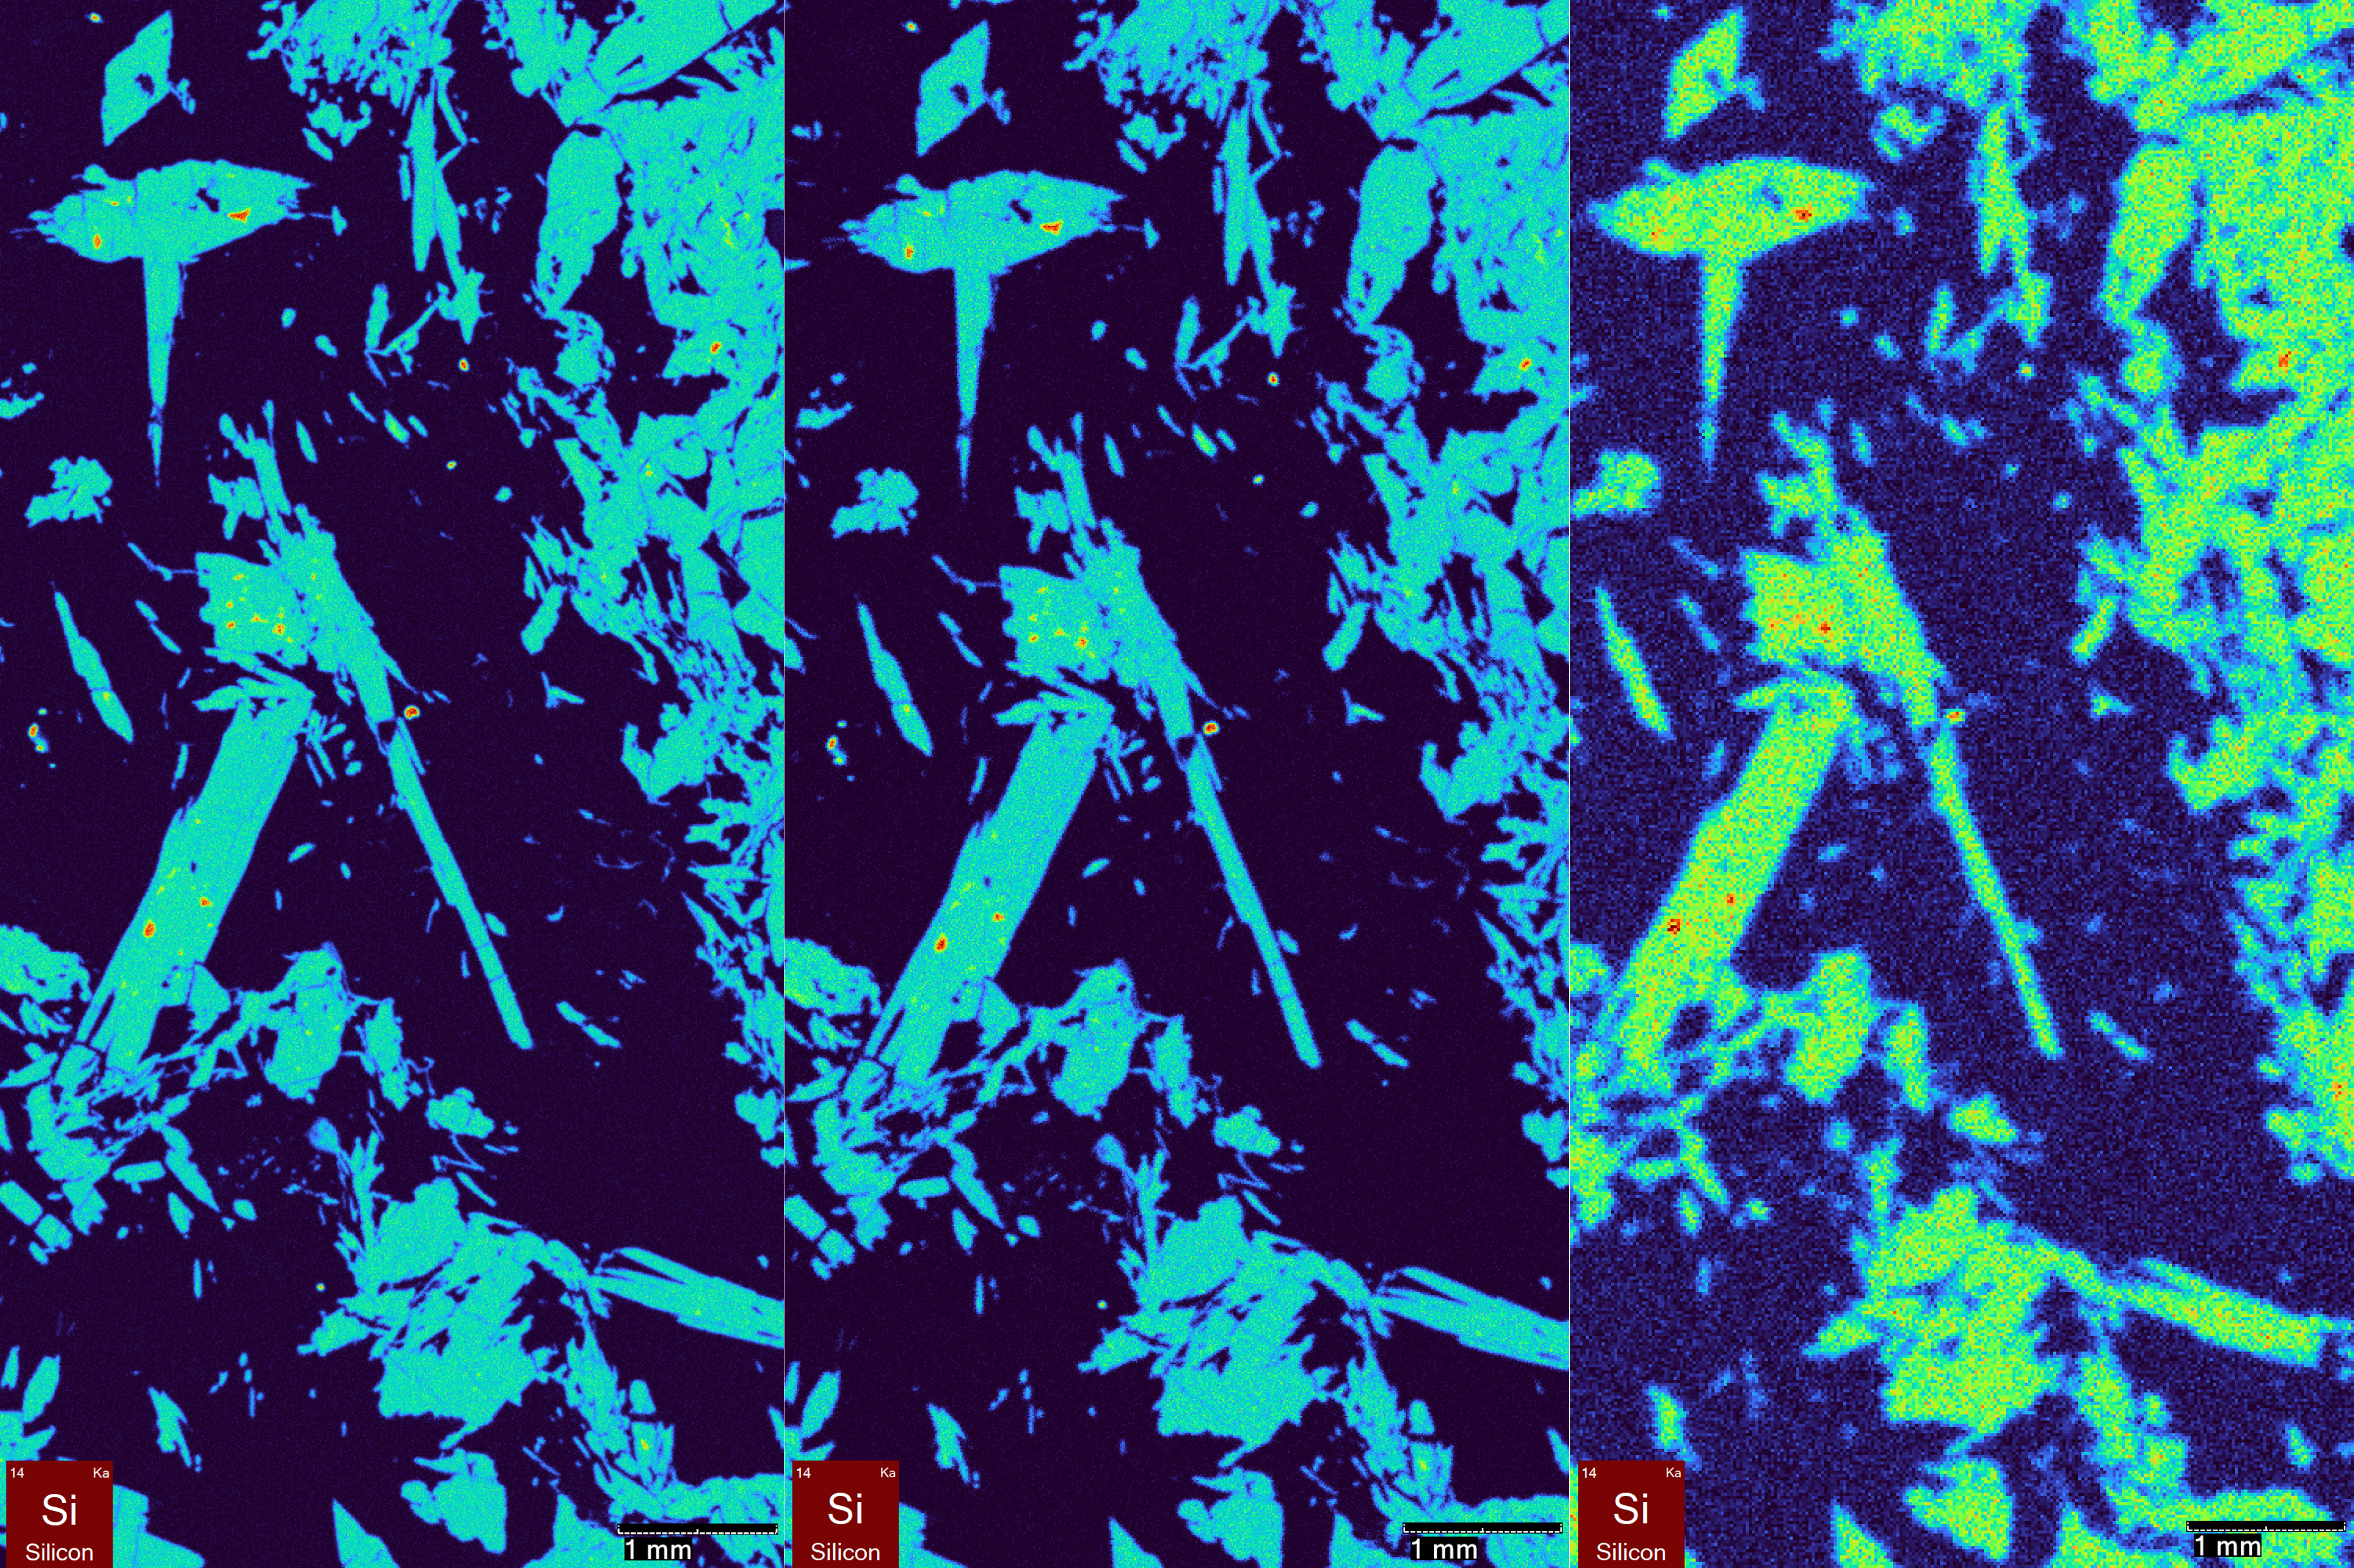
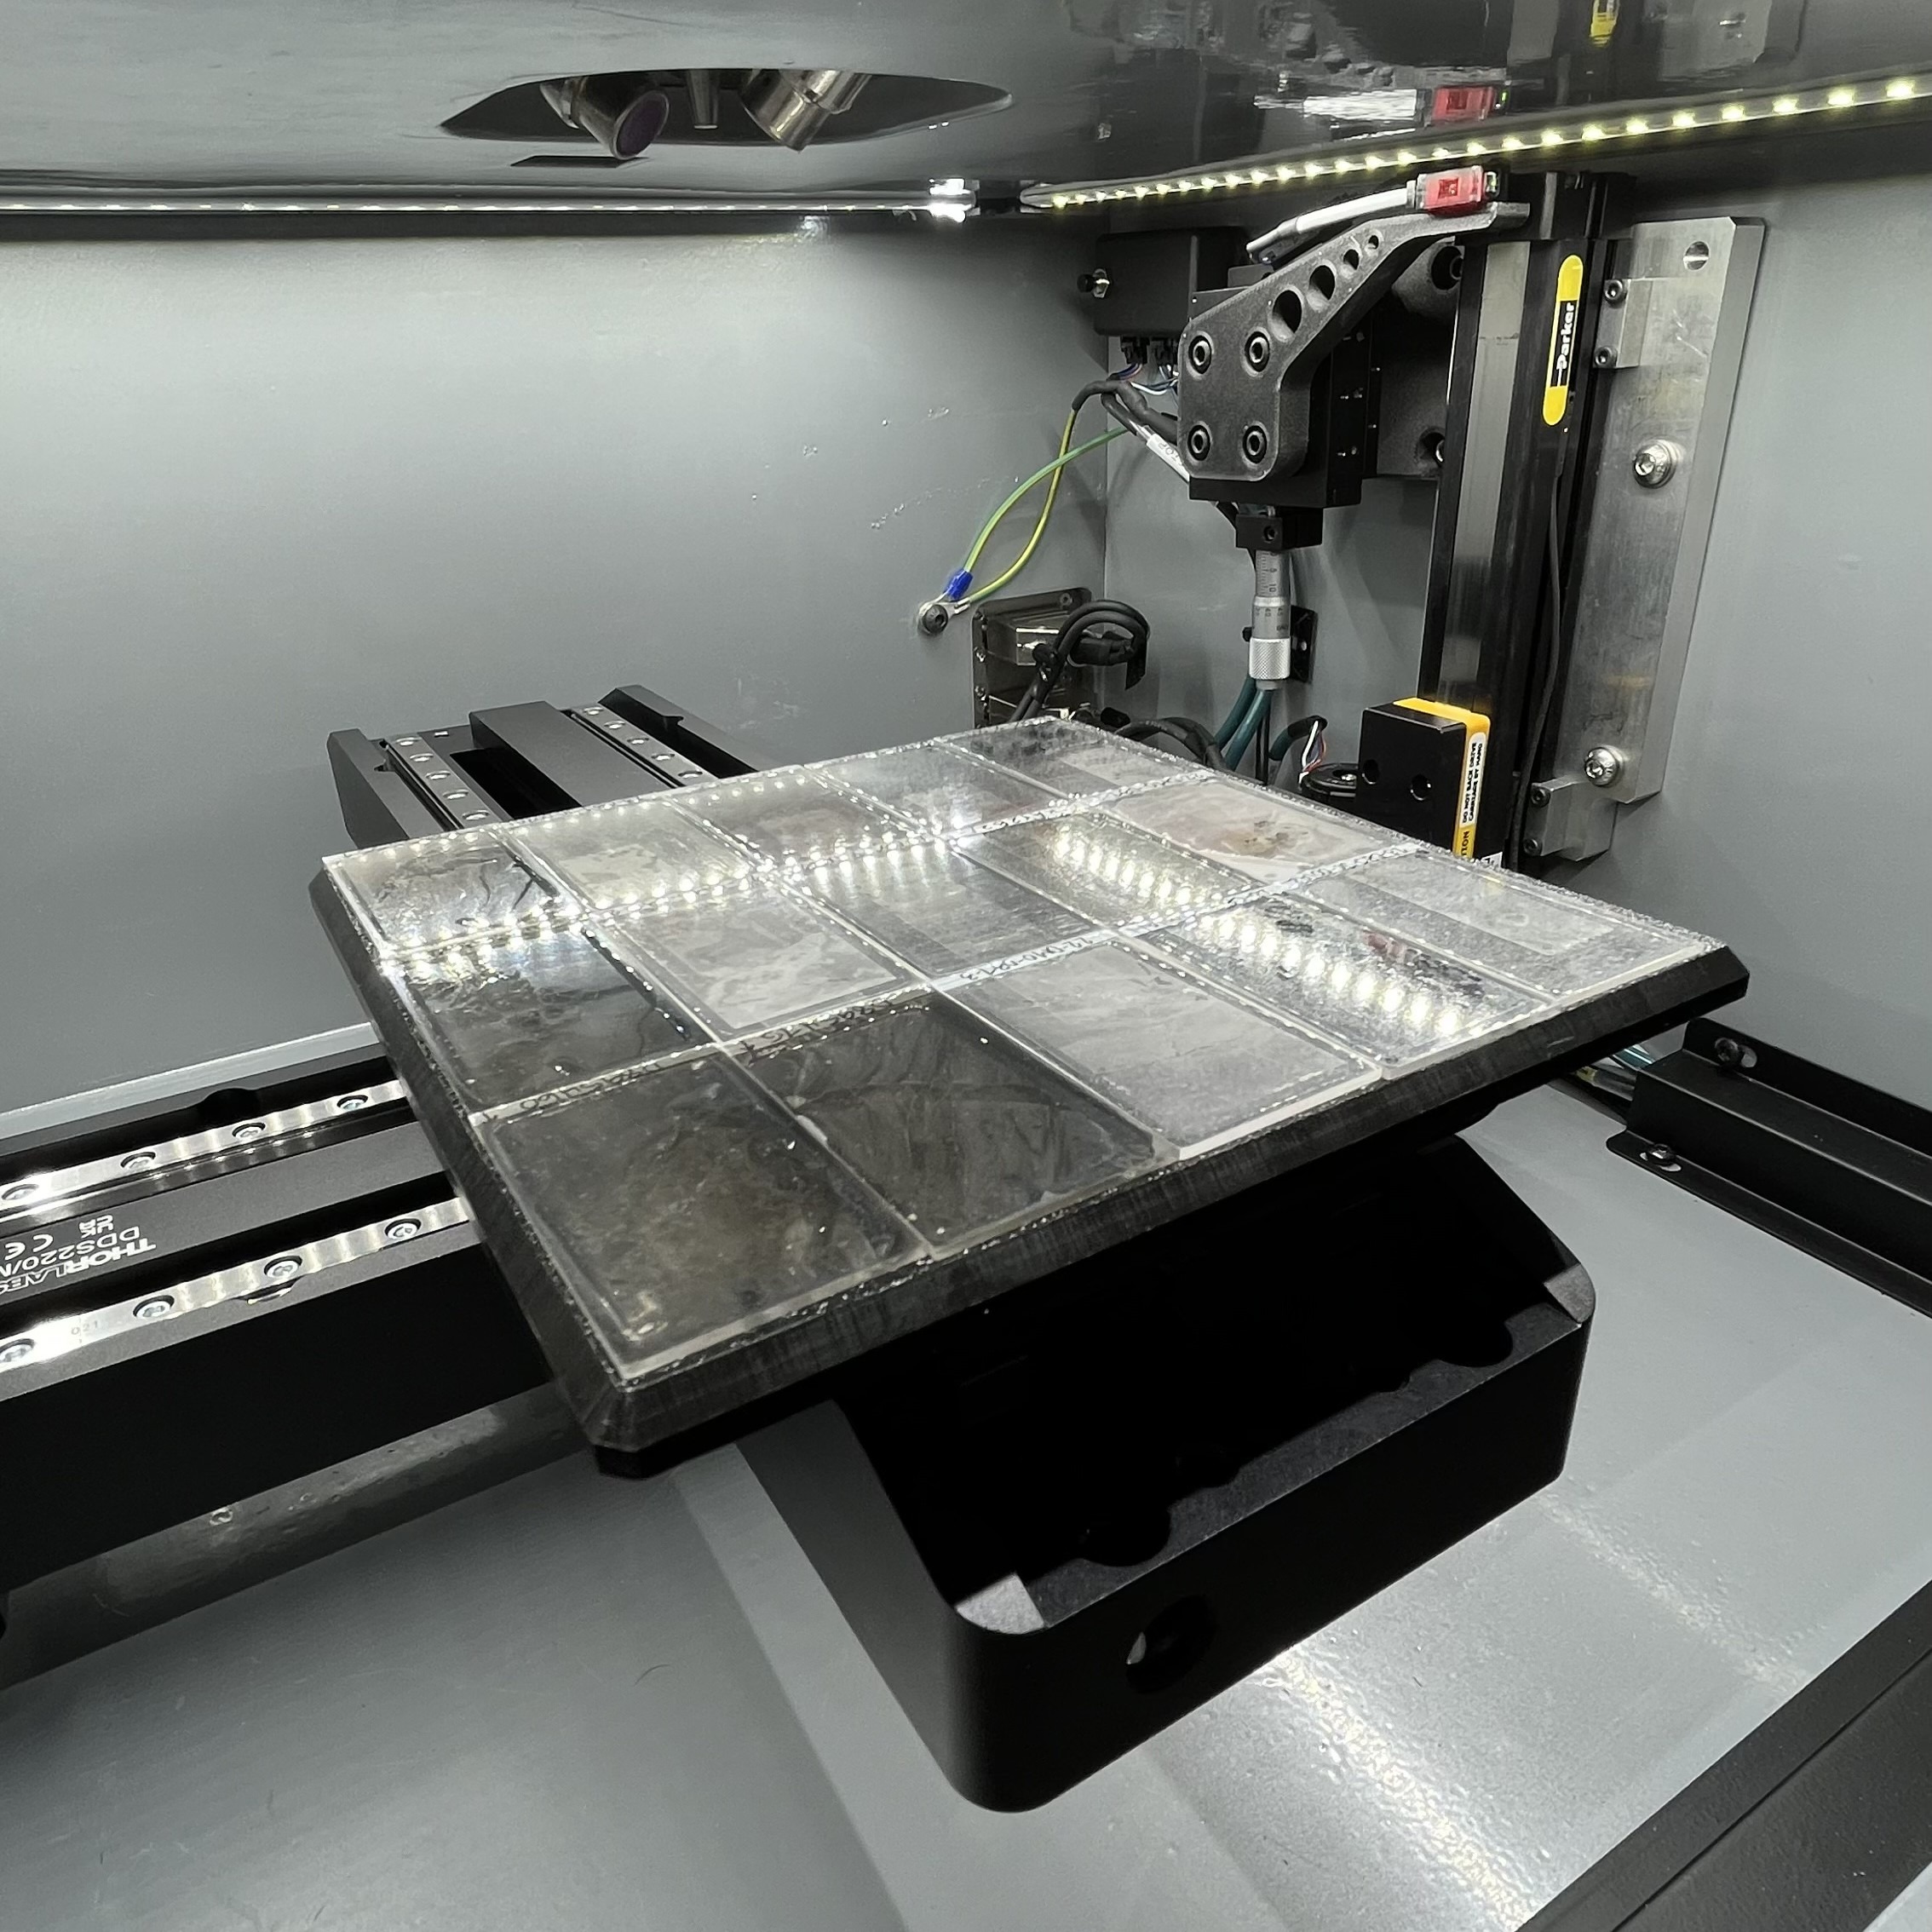
When it comes to XRF microscopic imaging (mapping), smaller is always better. Above is a geologic thin section comparing (left to right) a 5µm beam with a 10µm and 20µm beam respectively.
Atlas Apex w/ 5 µm round spot
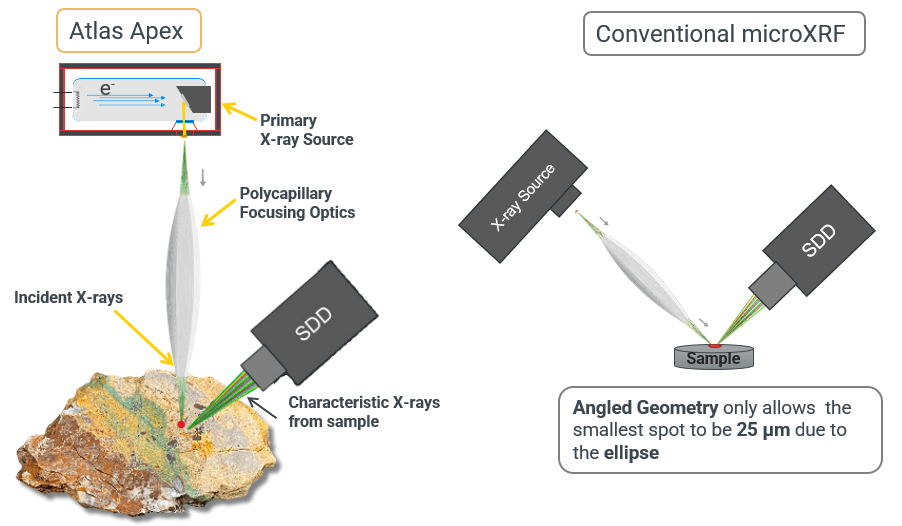
Perpendicular Geometry for an “On Target” Circular X-ray Spot
Atlas Apex M uses perpendicular microXRF geometry, with the X-ray beam directed normal to the sample surface. This geometry produces a circular excitation spot rather than an elongated elliptical footprint, helping preserve spatial accuracy during hyperspectral XRF mapping. The result is cleaner image fidelity, improved feature definition, and more reliable elemental distribution data across the sample surface.
Up to Four SDD Detectors for Faster Mapping
Atlas Apex M can be configured with up to four Silicon Drift Detectors, providing a large solid angle for efficient X-ray collection. This multi-detector architecture supports high count rates, improved throughput, and fast high-resolution mapping while maintaining excellent spectral performance. For laboratories that need to analyze large areas, compare many regions of interest, or process multiple sample types, this detector flexibility helps balance resolution, sensitivity, and speed.
Large-Area Automated Sample Mapping
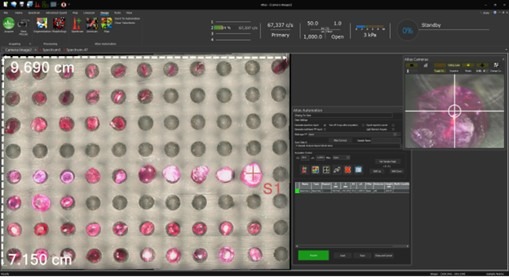
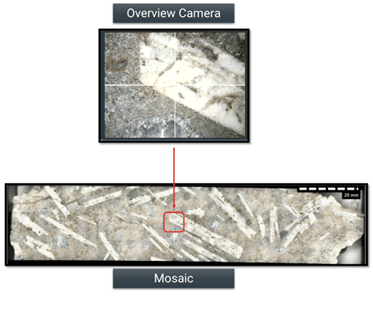
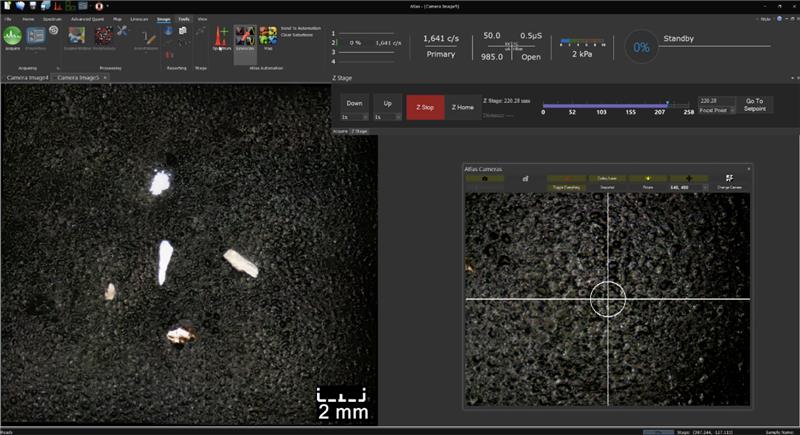
Atlas Apex M includes mosaic automation that stitches high-magnification overview camera images into a single large-area composite. This gives users a clear visual reference of the sample beyond the native camera field of view and makes it easier to define regions of interest for automated spot analysis, elemental mapping, and linescans. Integrated with Atlas Automation, mosaic imaging streamlines sample setup, navigation, and ROI selection.
Automated Spot, Mapping, and Linescans
Atlas Apex M supports automated microXRF workflows for spot analysis, elemental mapping, and linescans. Users can define points, regions, or paths across a sample and collect spatially resolved XRF data with minimal manual intervention. These automated workflows improve productivity, repeatability, and confidence when analyzing complex or heterogeneous materials.
Iridium Ultra Software for MicroXRF Analysis

Atlas Apex M is powered by Iridium Ultra, IXRF’s in-house software platform for acquisition, automation, mapping, quantification, phase analysis, and reporting. The software is designed to be accessible for new users while providing advanced tools for experienced analysts, including custom report generation, microXRF phase analysis, particle analysis, morphology tools, quantitative mapping, and ASTM testing methods.
Flexible Sample Types and Analysis Conditions
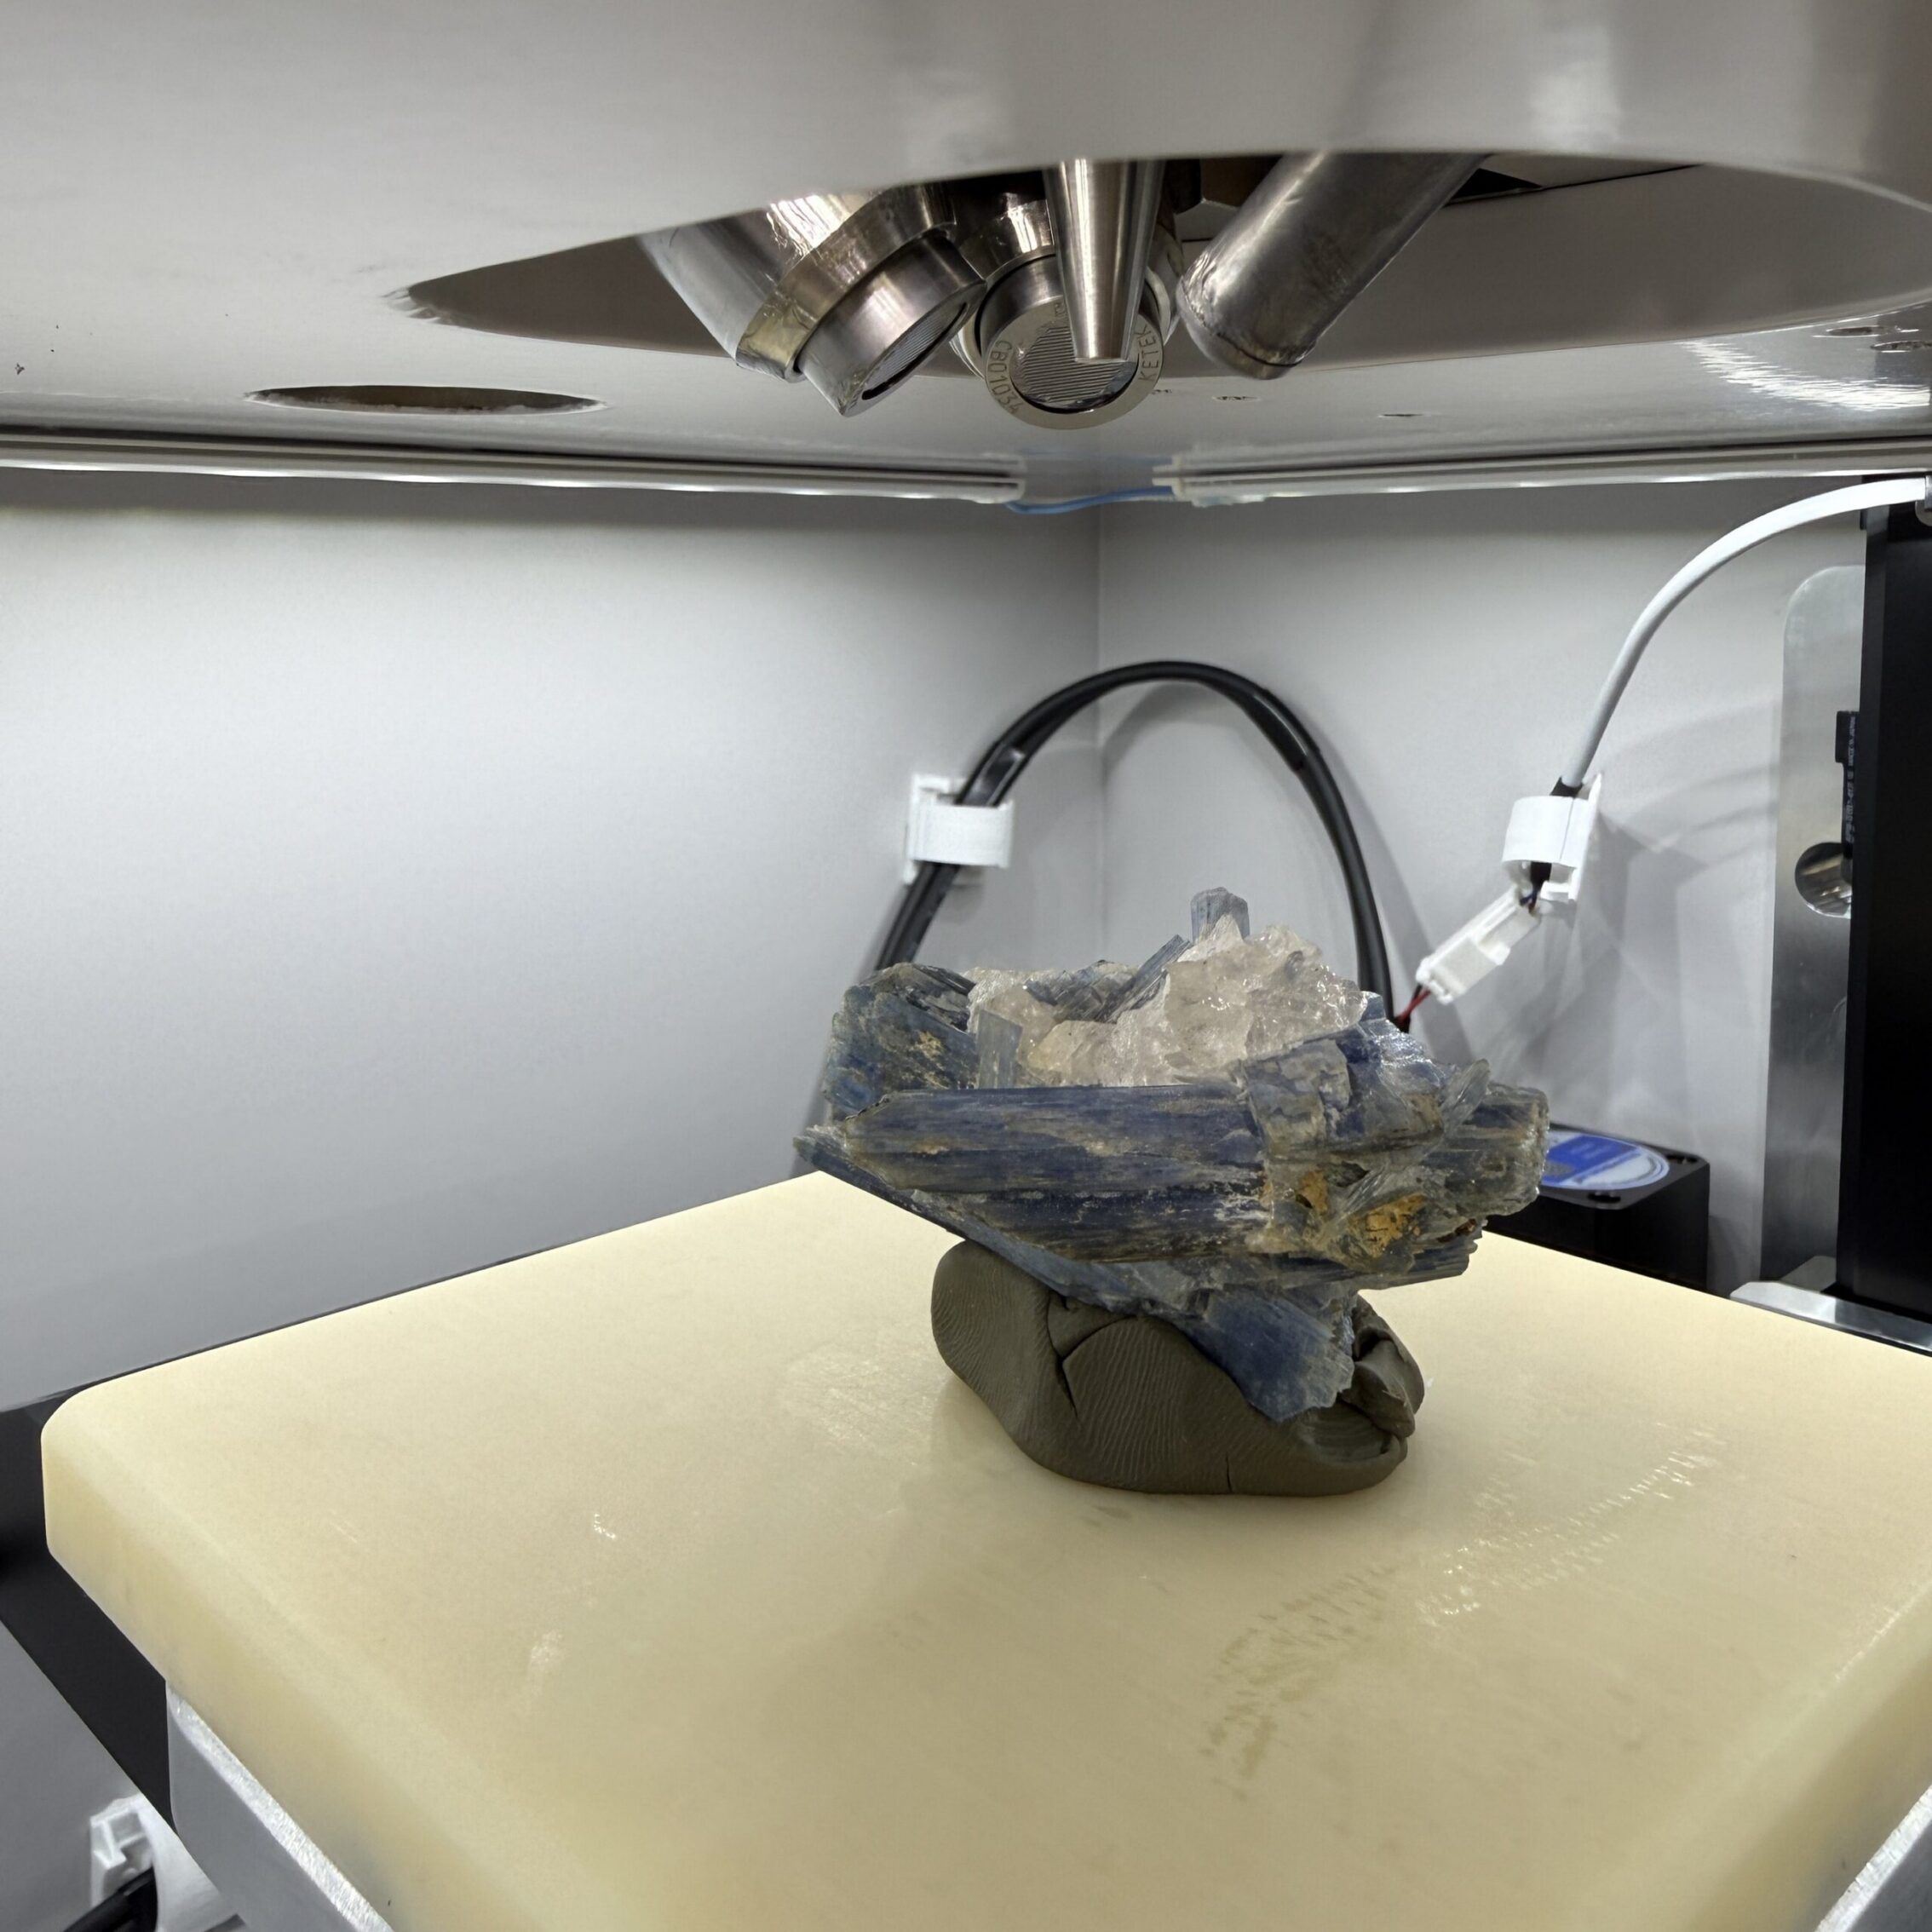
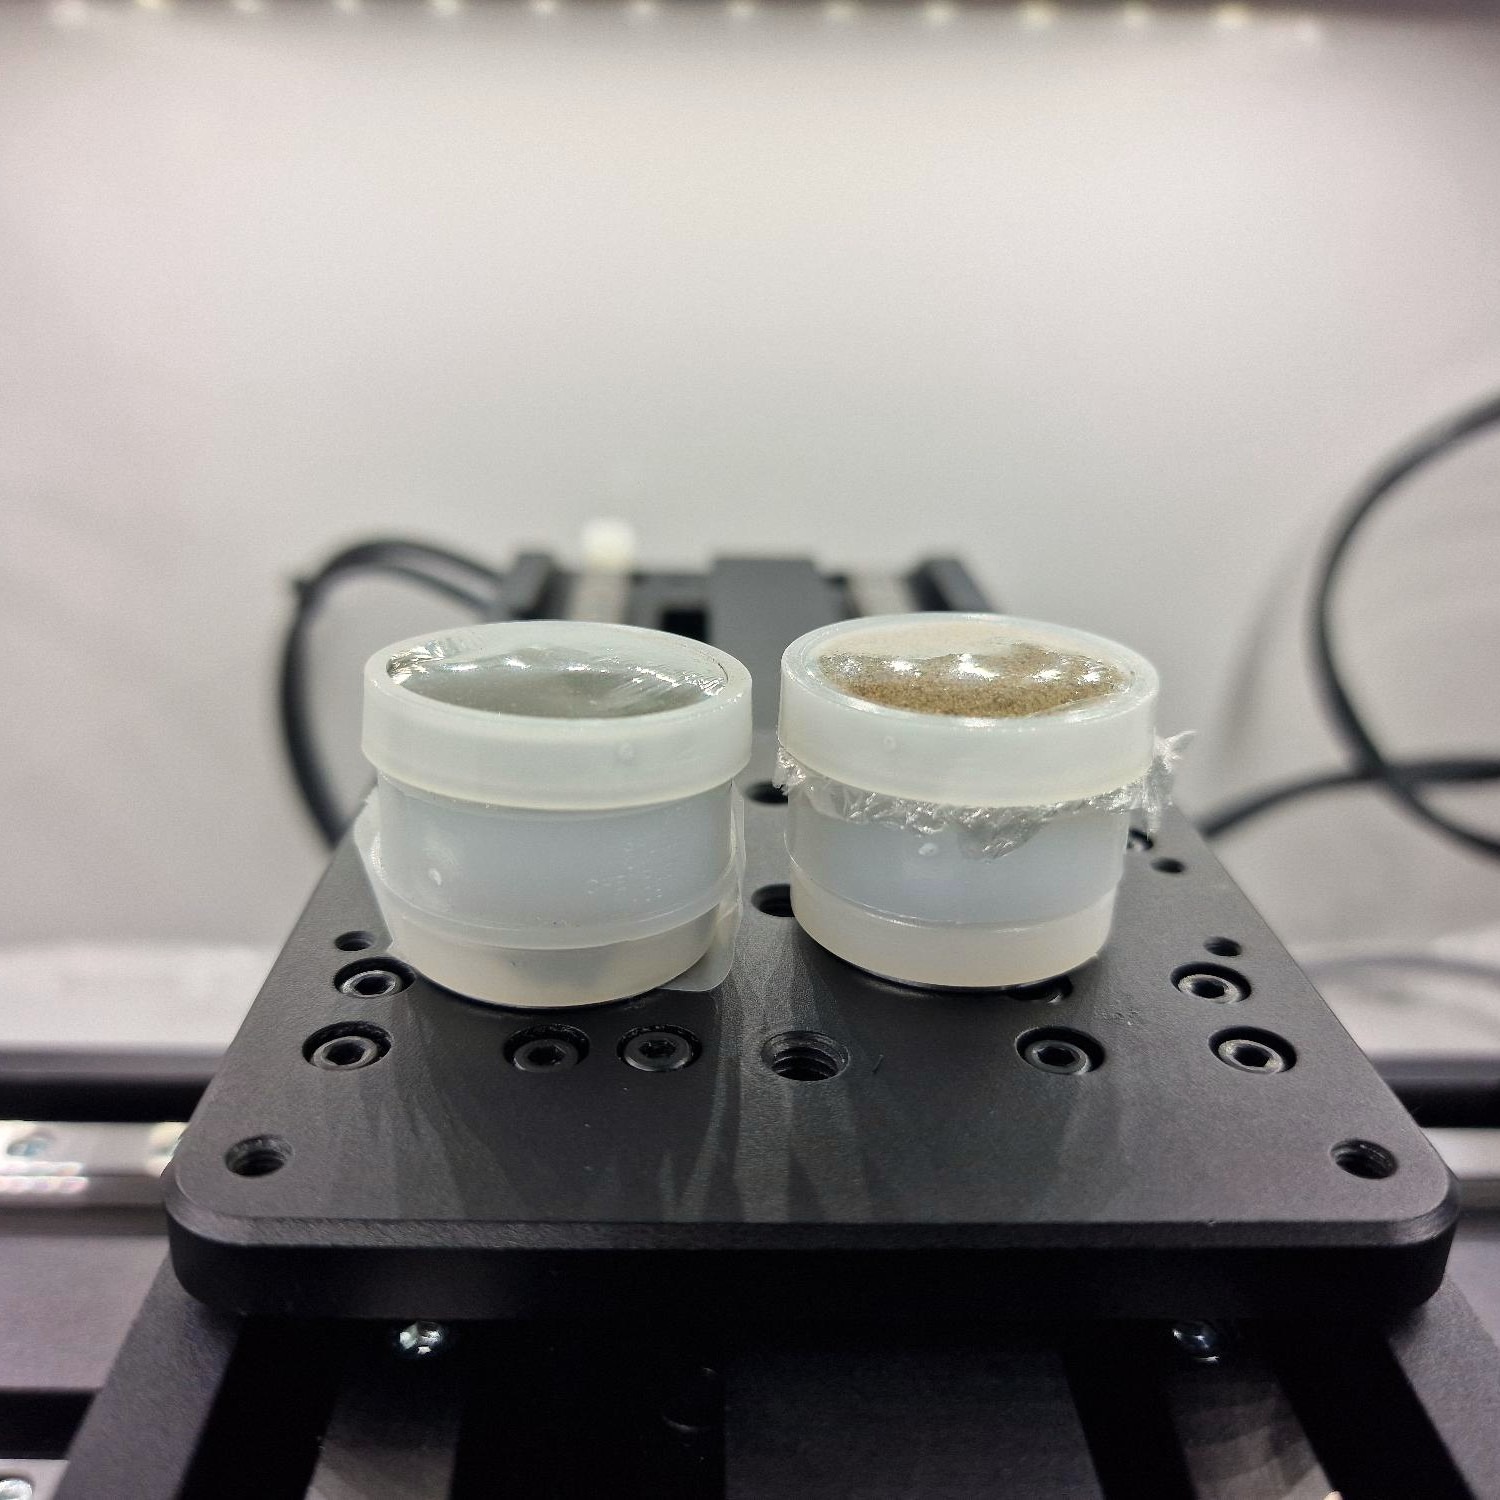
Atlas Apex M is designed to analyze a wide range of sample types and conditions. The system supports solids, liquids, powders, particles, thin films, coatings, and irregular samples, with operation in air, vacuum, or helium atmosphere. Its large vacuum chamber improves light-element sensitivity and allows the system to be ready for vacuum analysis in under one minute.
Designed and Manufactured the USA
Atlas Apex M is designed, manufactured, and supported by IXRF Systems in Austin, Texas. The instrument hardware, software, and application support are developed in-house, giving laboratories direct access to the expertise behind the system.
50 W Microfocus X-ray Source with Polycapillary Focusing Optics
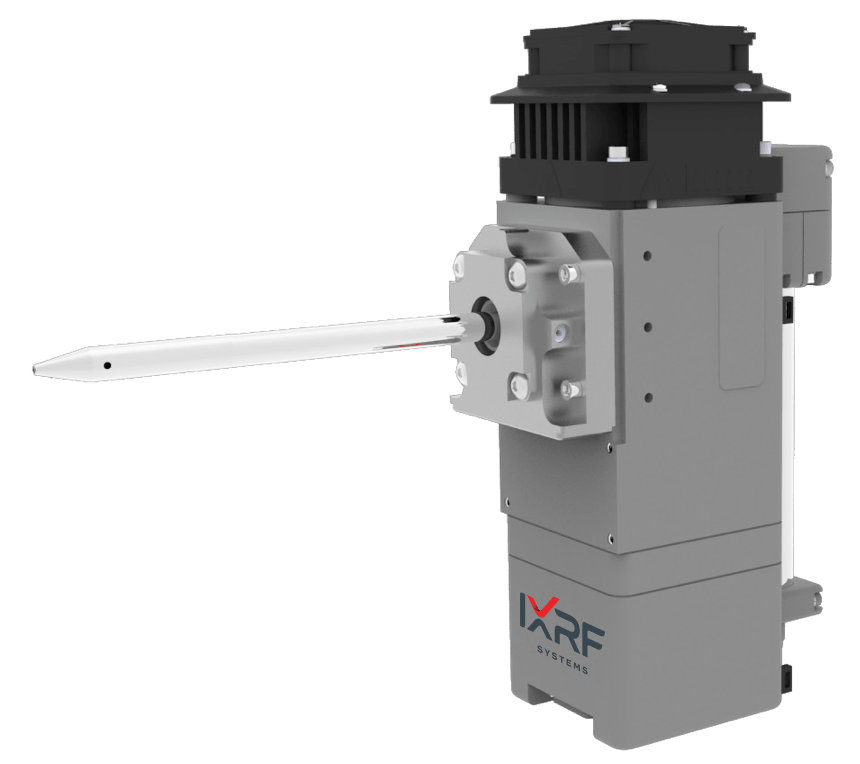
Atlas Apex M uses a 50 kV / 50 W Rh-target X-ray tube, with other target materials available depending on application requirements. The excitation system is paired with polycapillary focusing optics to deliver small, high-intensity primary X-ray spots for micro-scale elemental analysis.
Available primary X-ray spot sizes include 5, 10, 15, 20, 25, 40, and 100 µm, allowing users to balance spatial resolution, sensitivity, and throughput based on the sample and analytical goal. A filter wheel with up to seven filters plus an open position is positioned before the focusing optic, providing flexible beam conditioning for optimized excitation across different elements and materials.
Silicon Drift Detector Configuration
Atlas Apex M can be configured with up to four (4) Silicon Drift Detectors for increased X-ray collection efficiency, improved precision, and reduced acquisition times. This flexible detector architecture allows laboratories to match detector area and configuration to their analytical priorities, whether the goal is trace element sensitivity, fast mapping, high spectral quality, or high-throughput sample analysis.
Detector options range from 30 mm² to 65 mm² and are arranged in close-coupled geometry to maximize solid angle collection efficiency. Each detector is Peltier thermoelectrically cooled and supports excellent spectral performance, with energy resolution down to ≤125 eV depending on detector configuration and operating conditions.
Chamber and Perpendicular Geometry
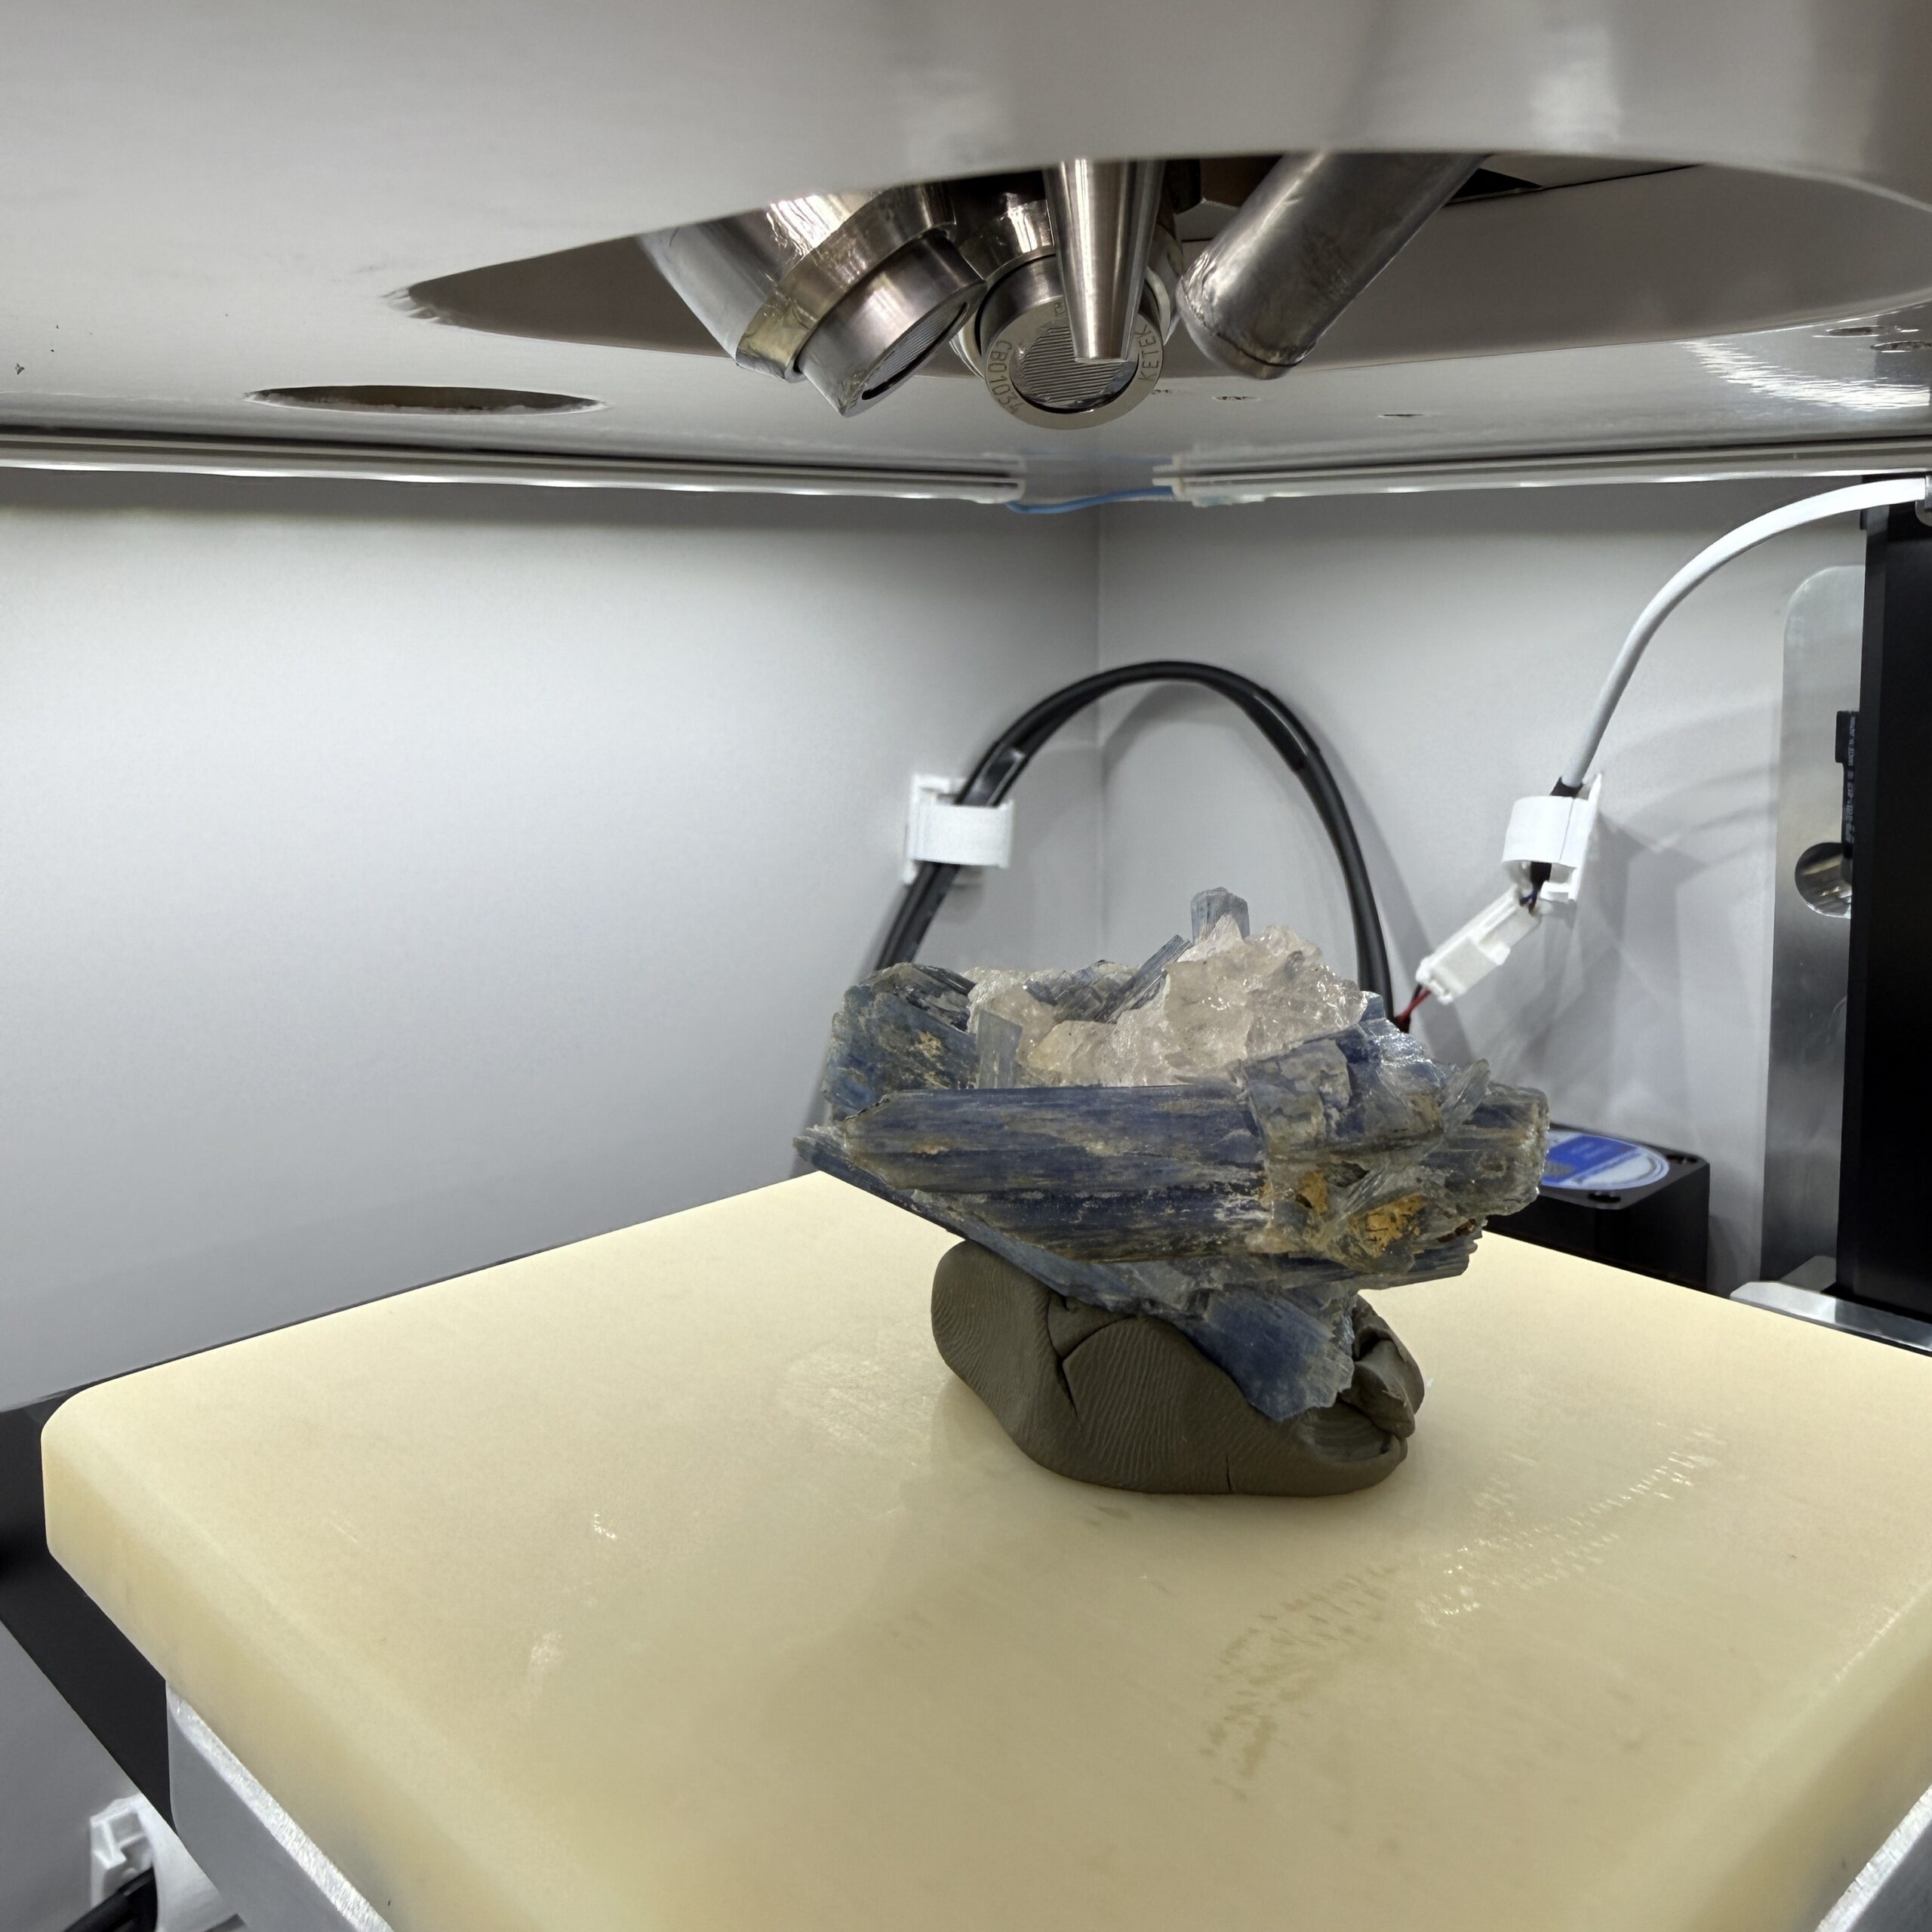
The Atlas Apex M chamber is designed to support a wide range of sample types and sizes while maintaining the geometry needed for accurate microXRF imaging. The chamber measures 508 × 457 × 254 mm, or 20 × 18 × 10 inches, and provides a large automated mapping area of 220 × 200 mm.
Atlas Apex M uses top-down perpendicular geometry, with the X-ray beam directed normal to the sample surface. This geometry helps maintain a circular excitation spot and supports accurate hyperspectral XRF imaging by reducing the spatial distortion associated with angled excitation geometries.
Three sample positioning and analysis cameras assist with navigation, region-of-interest selection, and sample alignment. Samples may also be positioned manually with the chamber door open, giving users additional flexibility during setup.
Automated XYZ Sample Stage
Atlas Apex M includes motorized X, Y, and Z stages for automated spot analysis, linescans, and elemental mapping. The high-speed stage system supports movement speeds up to 300 mm/s, map acquisitions at ≤1 ms per pixel, and positioning accuracy below 1 µm.
This precision motion platform enables repeatable analysis of small features, large-area maps, multiple regions of interest, and complex sample layouts. Custom sample adapters are also available to support specialized workflows, unusual sample geometries, and application-specific mounting requirements.
Hyperspectral XRF Mapping with Iridium Ultra
Atlas Apex M is powered by Iridium Ultra™, IXRF’s in-house microXRF software platform for Windows® 11. Designed for both new and advanced users, Iridium Ultra integrates acquisition, spectral processing, quantitative analysis, hyperspectral XRF mapping, phase classification, image analysis, and reporting into a single workflow.
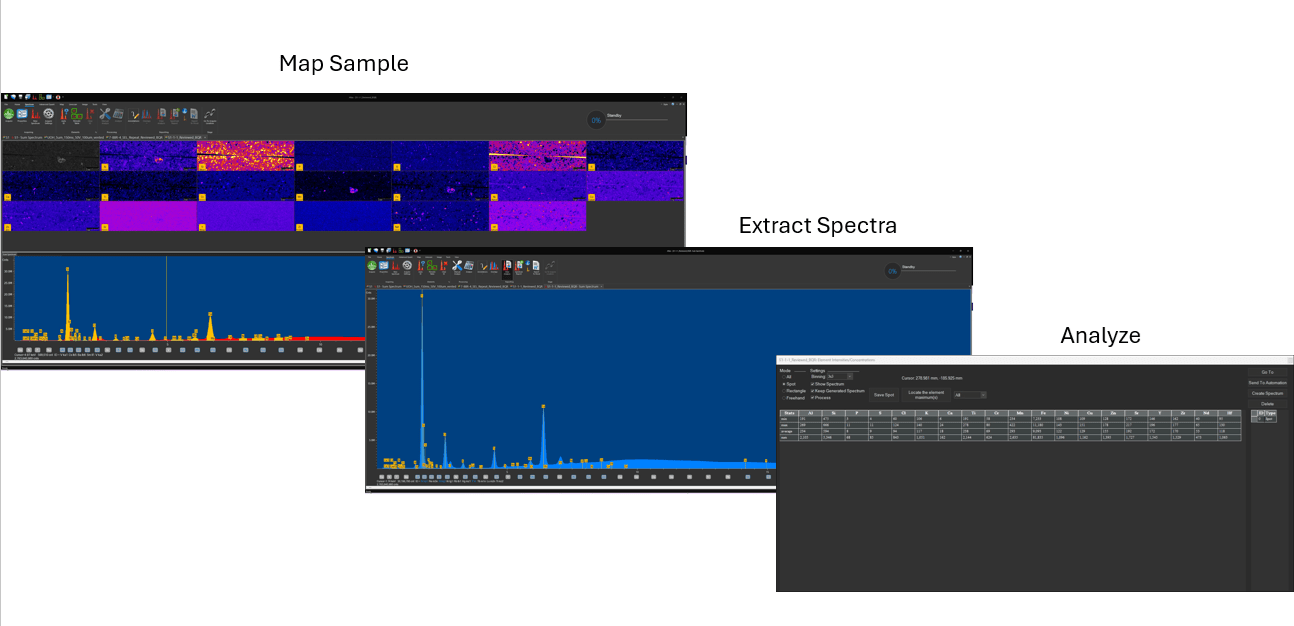
With Iridium Ultra, every pixel in an XRF map contains a full energy dispersive X-ray fluorescence spectrum. This allows users to move beyond simple elemental images and interact directly with the spectral data behind each map, region, feature, particle, or line profile. Users can extract spectra from points, areas, or freehand regions; compare elemental distributions; generate quantitative maps; classify phases; and create application-ready reports from the same software environment.
Quantitative microXRF Analysis
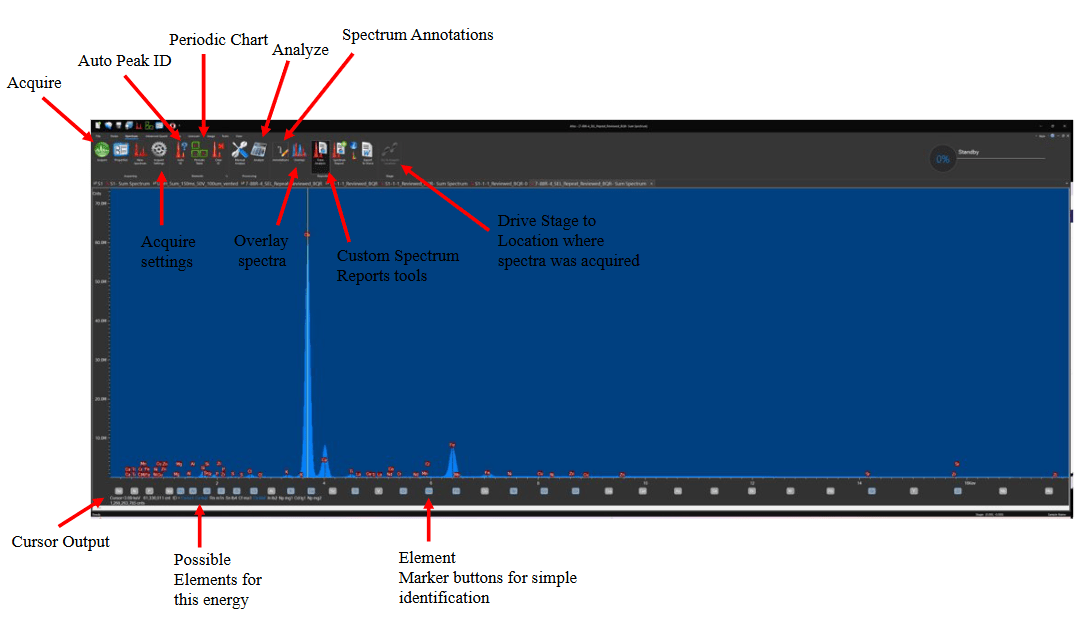
Iridium Ultra simplifies microXRF acquisition while providing the analytical depth required for complex materials characterization. Users can perform one-click acquisition, automatic peak identification, and quantitative analysis while retaining full control over processing, labeling, calibration, and reporting.
Key capabilities include:
Energy dispersive X-ray fluorescence software for microXRF and microEDXRF analysis
Fundamental Parameters analysis for solids, liquids, powders, and particles
Thin-film Fundamental Parameters analysis for up to 8 layers, including an infinite base or substrate
Up to 8 acquisition conditions per analysis
Automatic peak identification and customizable element labeling
Automatic overlap correction, background correction, sum peak treatment, escape peak treatment, and full spectral deconvolution
Empirical analysis using least squares and Lucas-Tooth methods
Quantitative Match and material classification database tools
Scrolling periodic table for fast element selection and spectral review
Drag-and-drop overlay tools for elemental image comparison
Custom report generation for documentation and data communication
Elemental and Phase Mapping
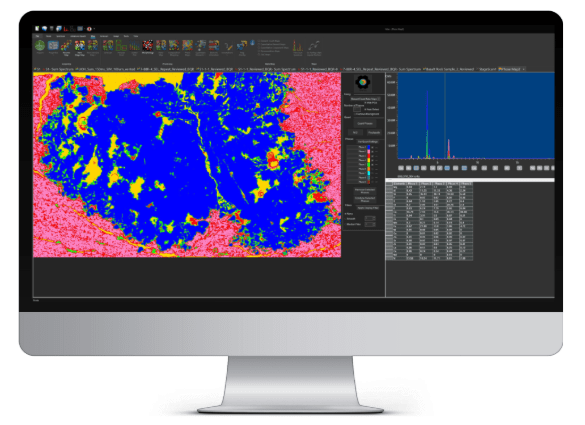
Iridium Ultra enables high-resolution hyperspectral XRF mapping where each pixel stores a complete XRF spectrum. This makes it possible to visualize elemental distributions, quantify regions of interest, identify small features, and explore complex sample heterogeneity with high spatial and chemical detail.
Mapping and imaging capabilities include:
Hyperspectral EDXRF mapping and imaging up to 9,998 × 9,998 pixels
Full-spectrum data storage at every pixel
Simultaneous acquisition of up to 35 elements
Live spectrum display during acquisition
Single or multiple map acquisition from overview or spot camera images
Map stitching and montage for large-area elemental imaging
Point, area, and freehand spectrum extraction from maps
Linescan creation directly from map data
Mouse-over display of intensities and concentrations
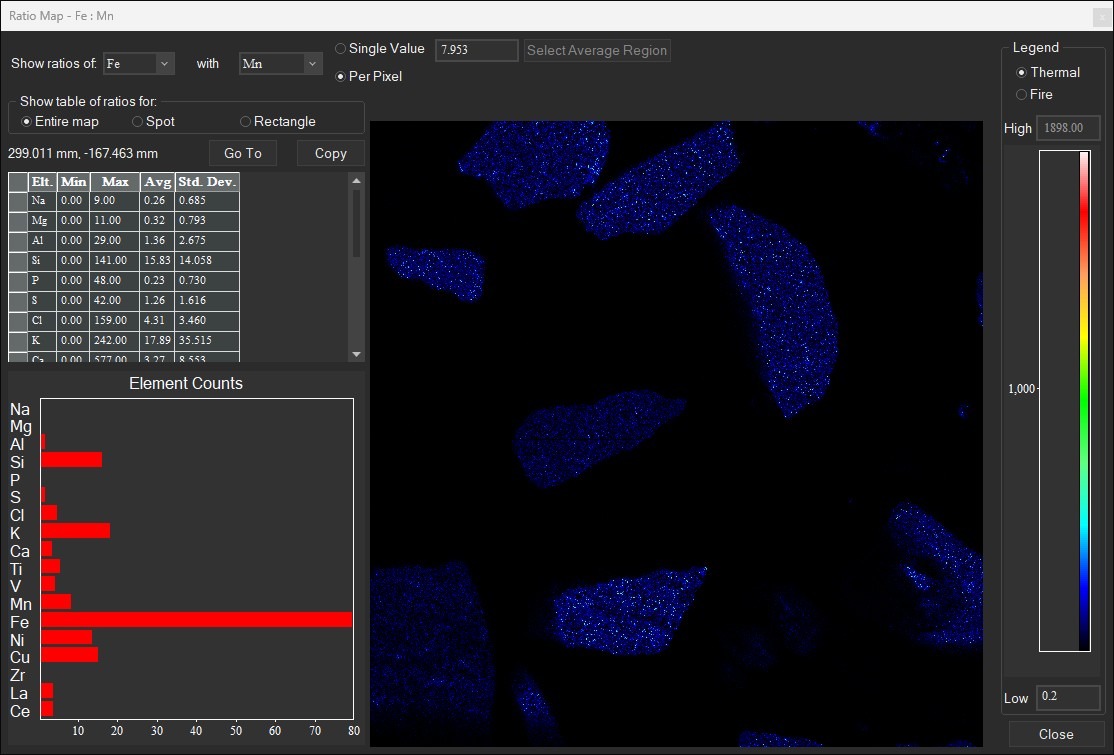
Multi-compositional map display for elements, compounds, components, materials, and user-defined compositions
Elemental and compound range overlays
Linescan overlays on optical or elemental images
Intuitive Interface with Advanced Analytical Depth
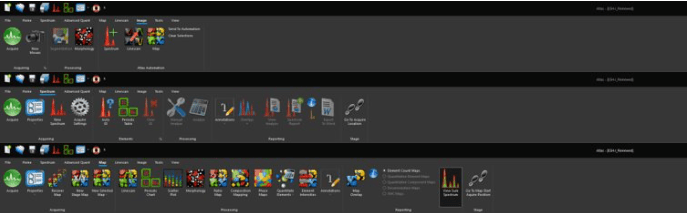
Iridium Ultra is designed to be easy for new users to navigate while giving advanced analysts access to powerful microXRF tools without requiring separate software add-ons. Its top-menu navigation, one-click acquisition tools, spectral displays, image overlays, and automated reporting features help users move efficiently from sample setup to final results.
User interface features include:
Top-menu navigation
One-click acquisition, peak identification, and quantification
Spectral display with up to 25 individual spectrum windows
Point-and-click cursor display of energy, counts, and possible elements
Customizable automatic element identification and peak labeling
Scrolling element markers from the periodic table
Complete spectrum annotation tools, including customizable text and lines
Drag-and-drop overlays for rapid elemental image comparison
Standard inclusion of advanced tools without additional software options
Mosaic Imaging and Automated ROI Selection
Iridium Ultra includes high-resolution optical imaging tools that support sample navigation, region selection, and correlation between optical features and XRF data. Mosaic navigation stitches high-magnification overview images into a single large-area composite, giving users a clear visual reference for defining analytical regions across the sample.
Mosaic and optical imaging tools include:
Ultra-high-definition optical mosaic imaging up to 100 megapixels
User-configurable mosaic resolution, limited by storage capacity and stitching parameters
High-magnification image stitching and montage from the overview camera
Full-sample visualization beyond the native 13 × 10 mm camera field of view
Multi-point automated analysis directly from the image
Motorized zoom and focus control through software
Live imaging during stage movement
Adjustable LED illumination
Integrated crosshair overlay for accurate alignment of analysis points and mapping areas
Imaging field of view matched to X-ray spot size for accurate optical-to-XRF correlation
Streamlined ROI definition through integration with Atlas Automation
Phase Analysis and Mineral Identification
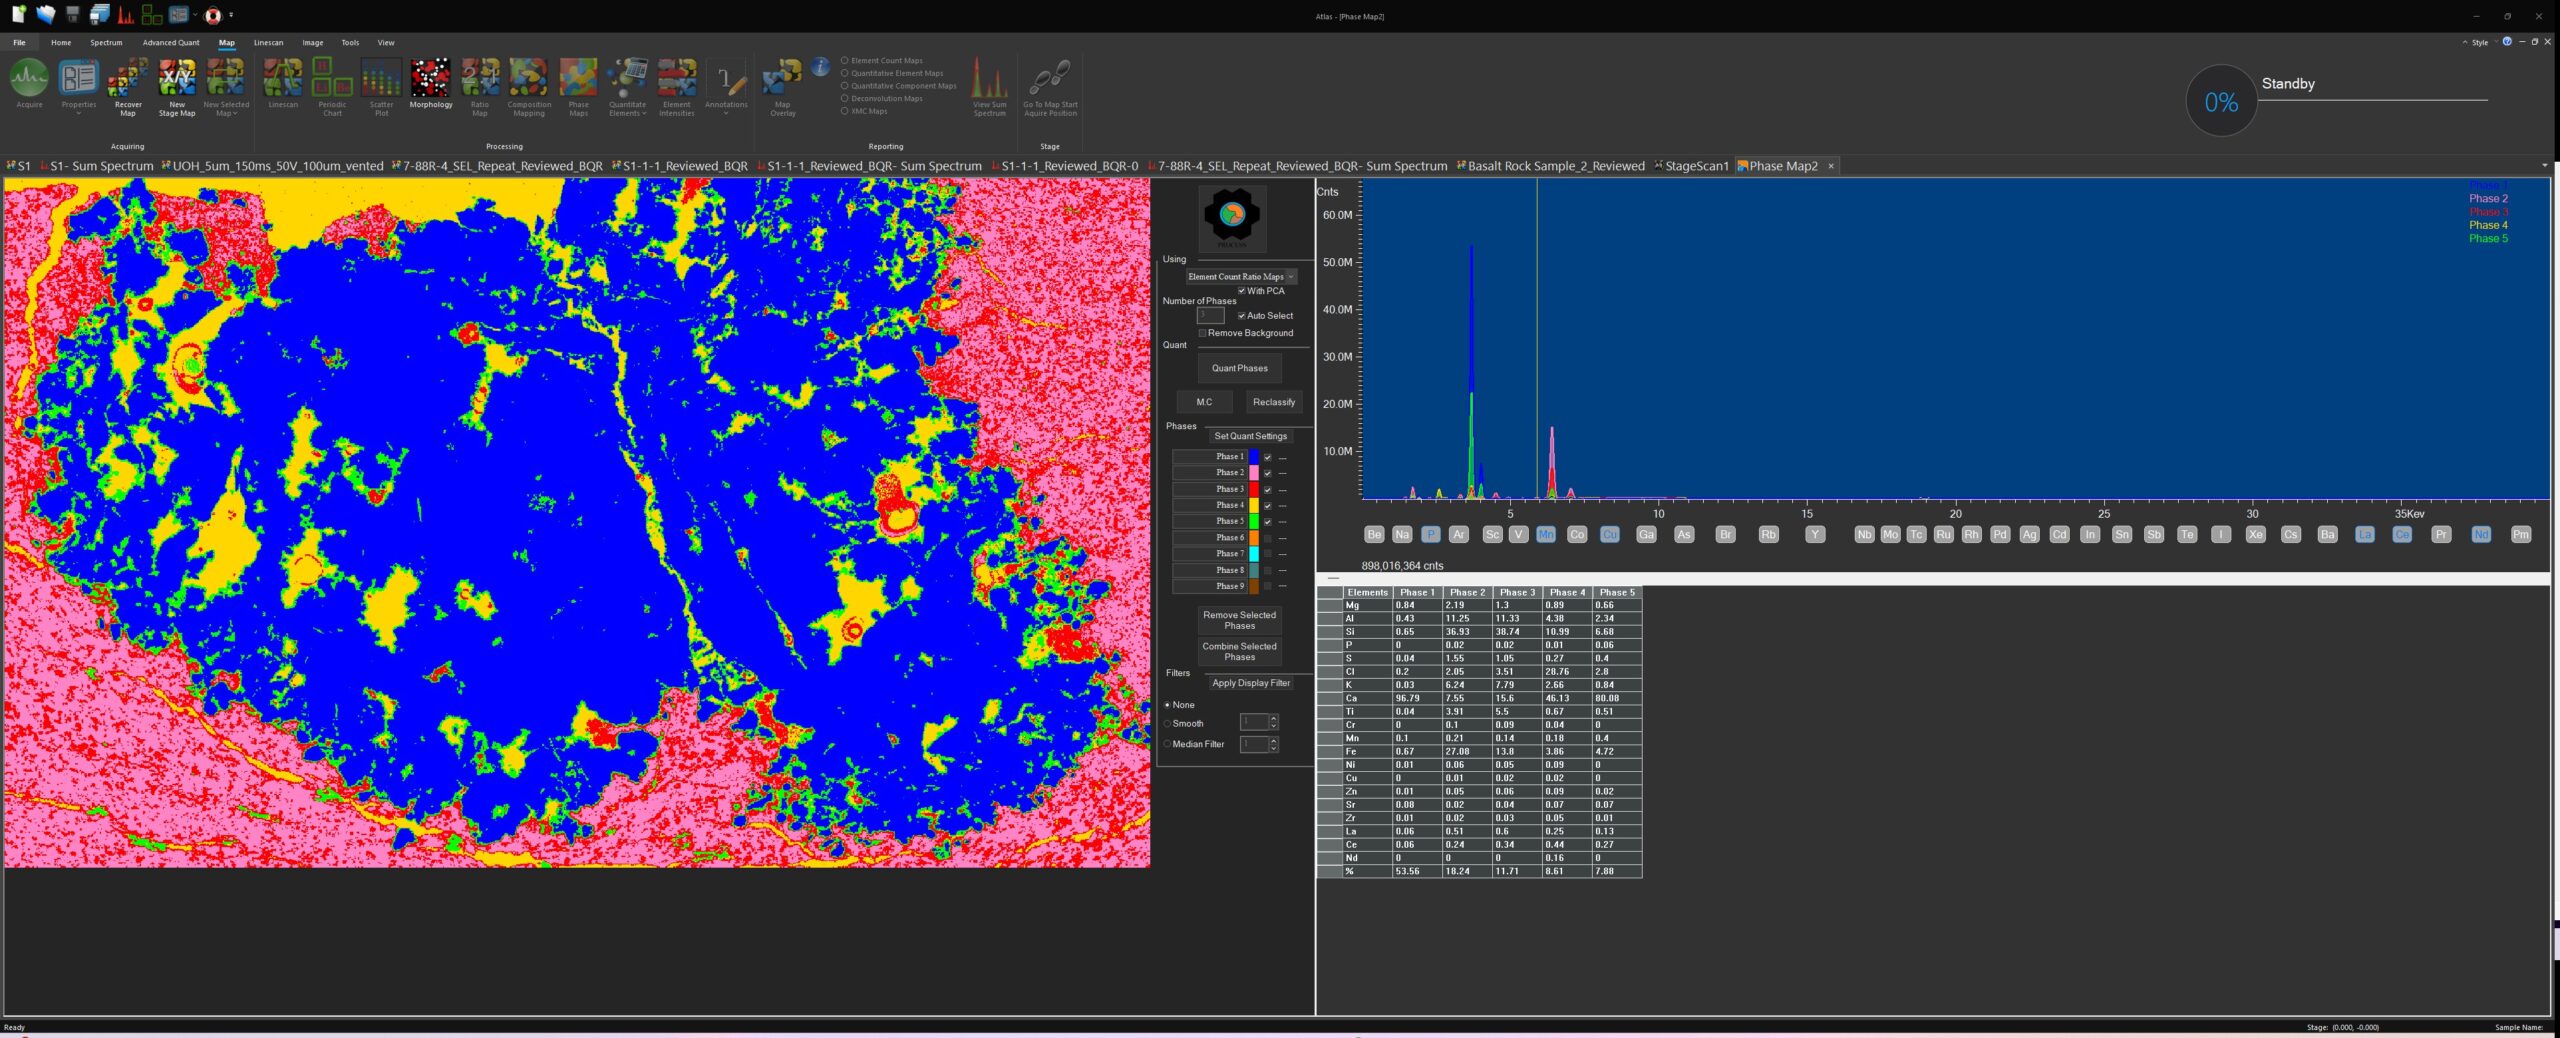
For geological and materials research, Iridium Ultra includes advanced tools for phase analysis, mineral identification, and compositional classification. Principal Component Analysis can be applied to intensity-based or concentration-based maps to help identify chemically distinct regions and visualize phase distributions across the field of view.
Phase and mineral analysis capabilities include:
Principal Component Analysis for exploratory phase mapping
PCA analysis using intensity maps or concentration maps
Color-coded phase maps for visual classification
Percent field-of-view calculation for each identified phase
Multi-compositional map display for elements, compounds, and materials
IU-GEOCHEM: Geological Elemental Observation and Characterization of High-Efficiency Mapping
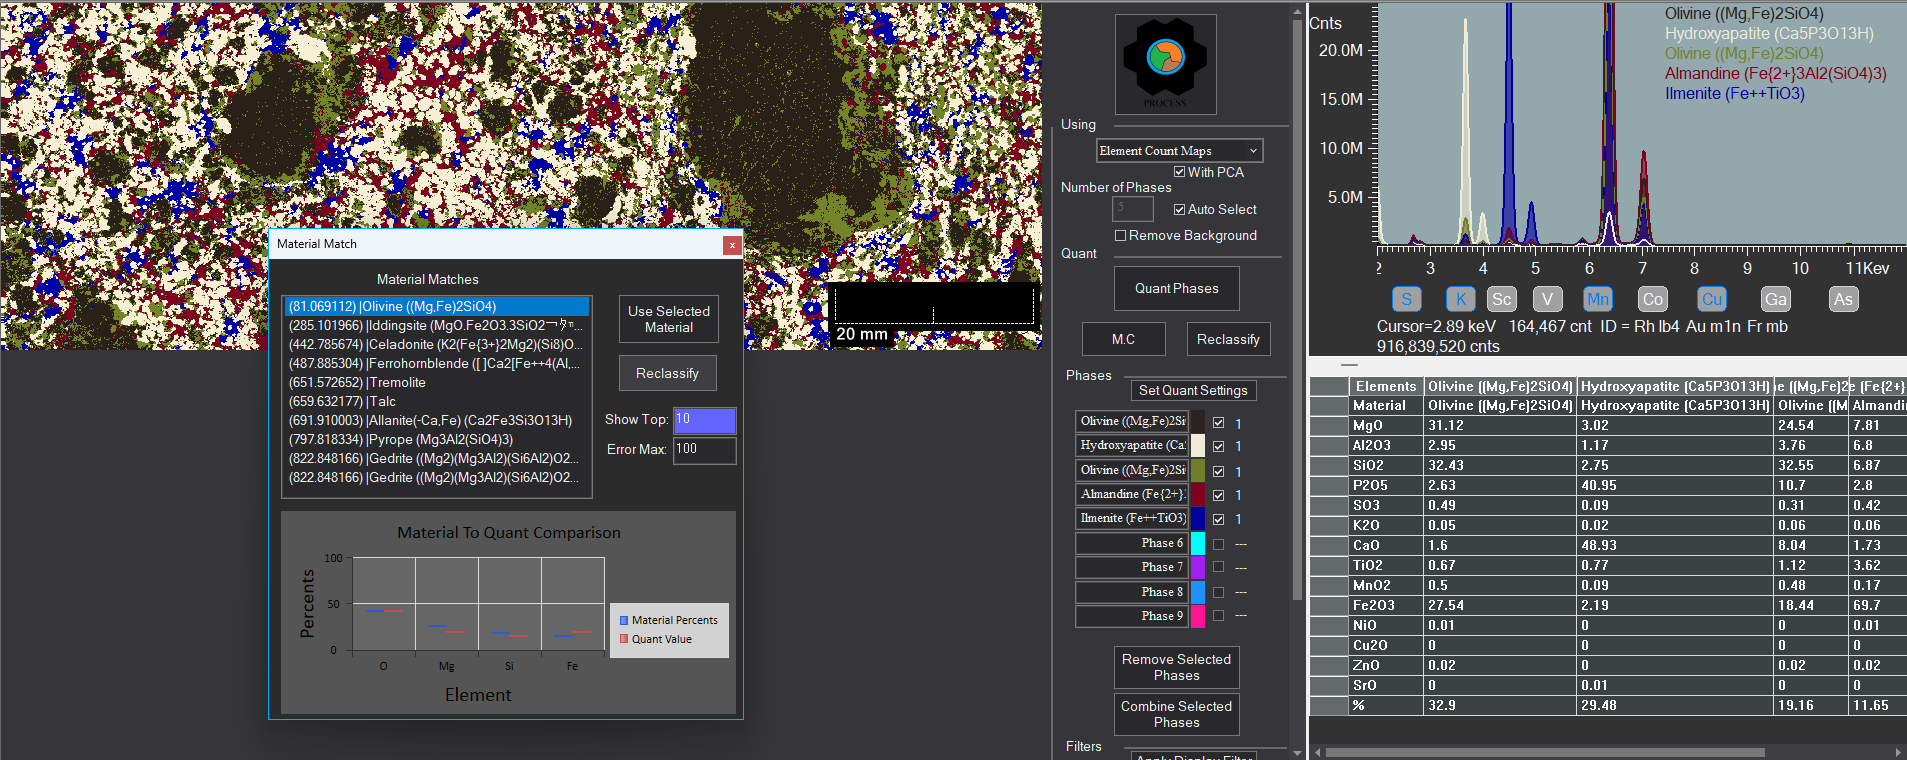
Mineral identification supported by a comprehensive database of approximately 4,000 minerals
Fast classification of mineral phases from hyperspectral microXRF data
Composition Imaging Analysis
User-defined compositions define the image
Maps can be defined by intensities or concentrations
Maps can be elements, compounds, components, materials, etc.
Linescan Profile Analysis
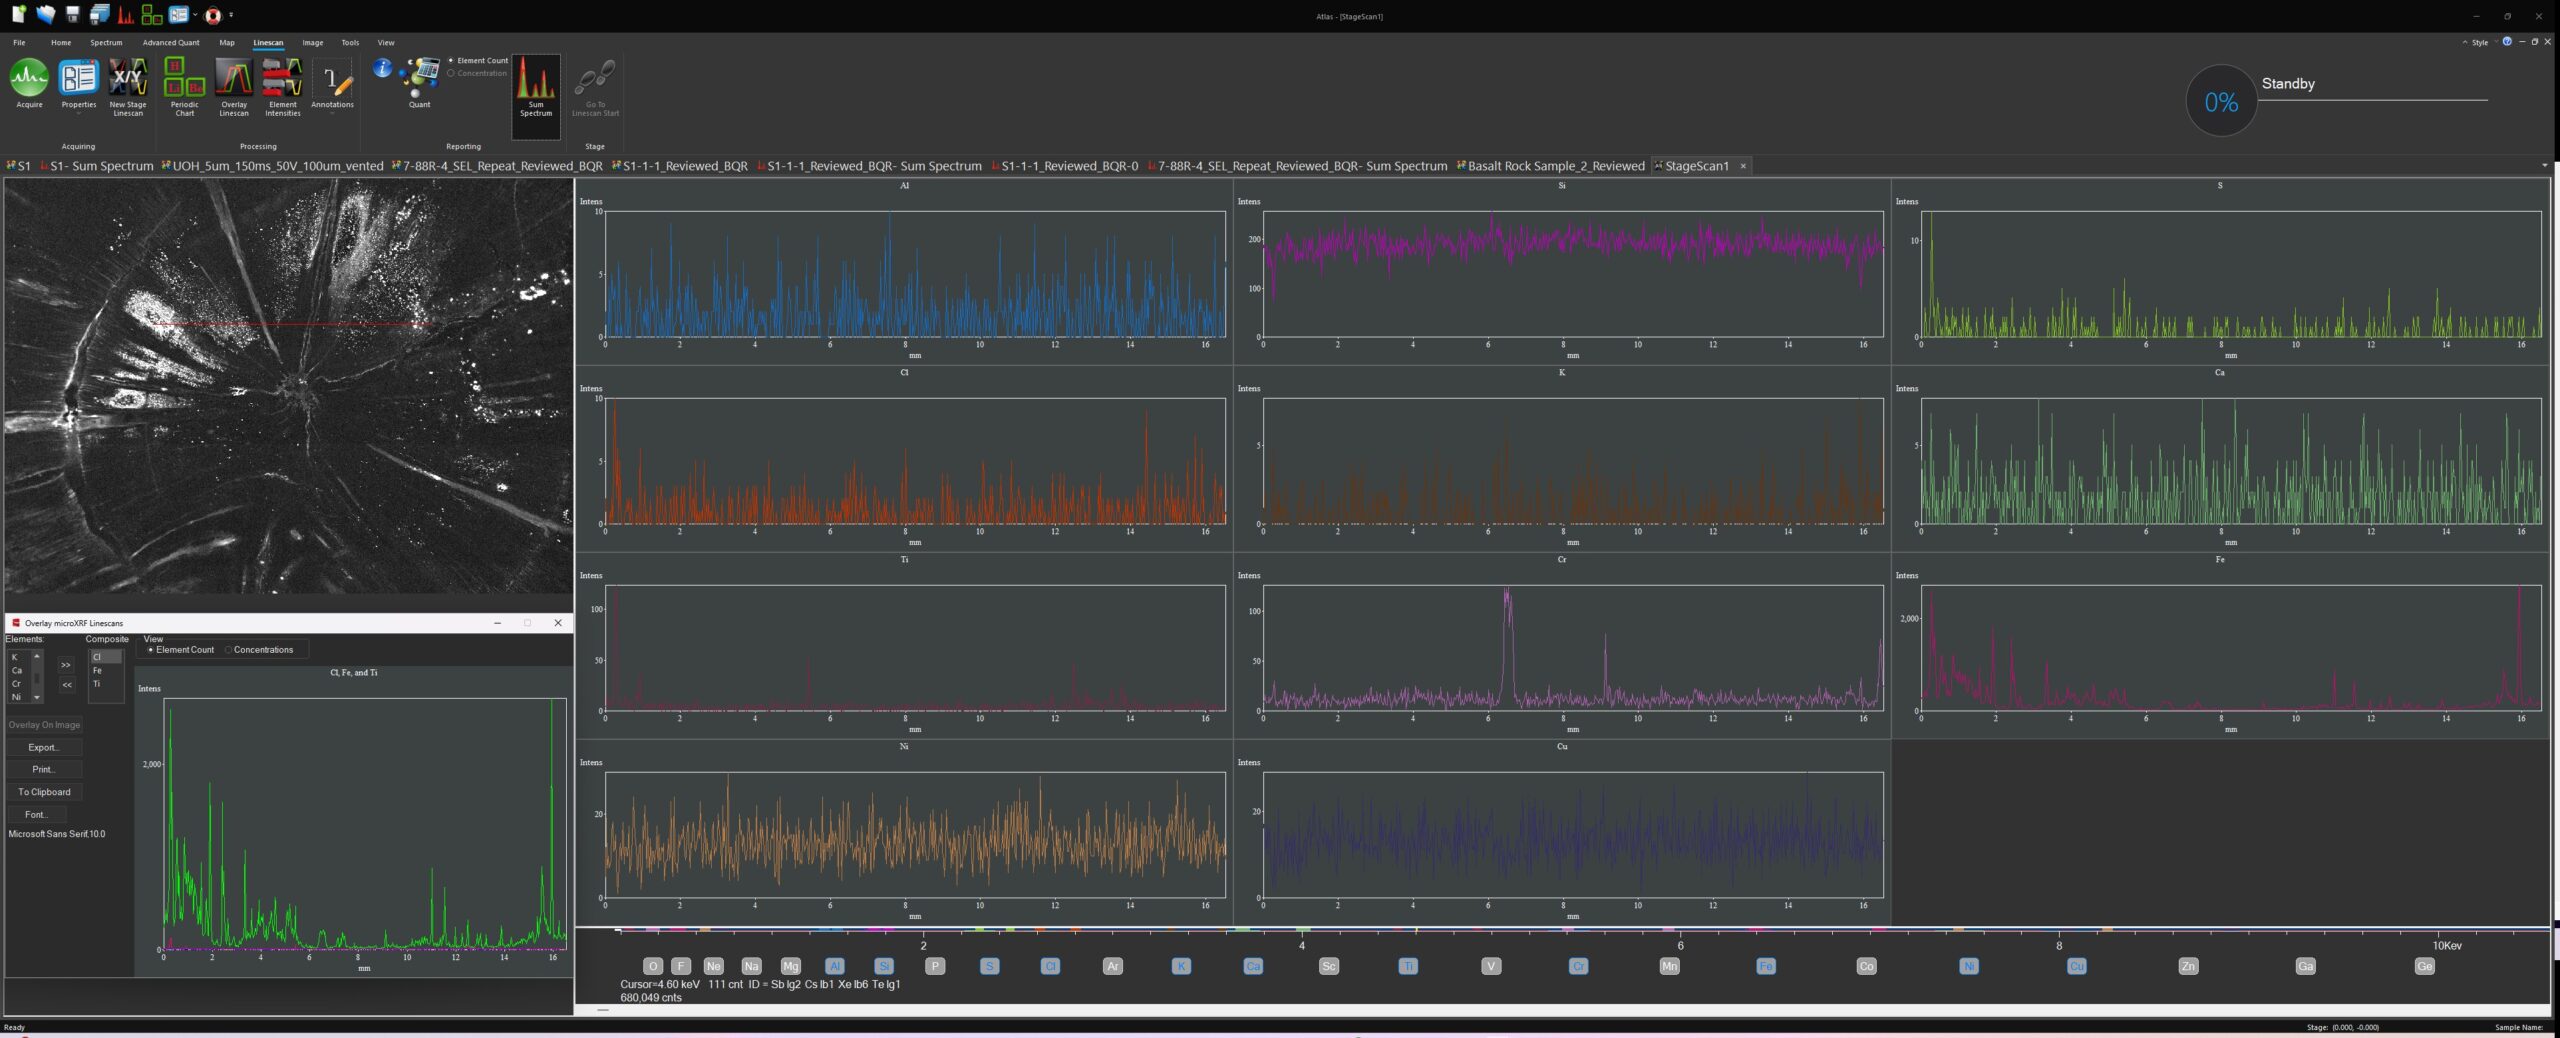
Iridium Ultra supports detailed line profile analysis for evaluating relative elemental intensity or concentration changes across a defined path. Linescans can be used to investigate interfaces, coatings, diffusion zones, compositional gradients, phase boundaries, and long-distance elemental variation.
Linescan capabilities include:
Relative elemental concentration or intensity along a selected line
Separate display of each element for clear trend analysis
Tiled or stacked chart views for comparison
Overlay of linescan data on optical or elemental images
Support for long linescans across large sample areas
High-resolution analysis of ppm-level features, depending on sample, configuration, and acquisition conditions
Particle and Feature Analysis
Iridium Ultra includes morphology and particle analysis tools that allow users to identify, count, measure, classify, and evaluate features based on both image characteristics and elemental composition. This is especially useful for particles, inclusions, contamination, defects, and other discrete features in complex samples.
Morphology and particle analysis tools include:
Segmentation and feature segregation
Particle analysis package with border removal, sorting, and exclusion
Classification by composition
Rapid feature size measurements
Elemental identification of particles, inclusions, and surface features
Automated counting and measurement by feature type
Additional data collection from selected features
Extensive image analysis tools adapted from advanced microscopy workflows
Developed In-House in Austin, Texas
Iridium Ultra is written and supported in-house by IXRF Systems in Austin, Texas. Because the hardware, software, and application support are developed together, Atlas Apex M users benefit from an integrated microXRF platform designed for practical laboratory workflows, advanced elemental mapping, and long-term analytical flexibility.
Atlas Apex M features
Atlas Apex M delivers high-performance microXRF analysis in a compact benchtop platform. Designed for high-resolution elemental mapping, hyperspectral XRF imaging, and quantitative micro-scale analysis, it combines a 50 kV / 50 W polycapillary X-ray source, spot sizes down to 5 µm, configurable SDD detectors, and a large sample chamber for flexible laboratory workflows.
Key features include:
Benchtop / tabletop microXRF spectrometer design
X-ray spot size down to 5 µm with anti-halo optic
SDD detector configurations with active areas up to 65 mm²
Large chamber volume for diverse sample types
Multi-point, multi-area, mapping, and linescan automation
Air, vacuum, or helium operation for solids, liquids, powders, particles, thin films, and coatings
Iridium Ultra software running on Windows® 11 for acquisition, mapping, quantification, phase analysis, and reporting
Specifications
Specifications
Elemental range:
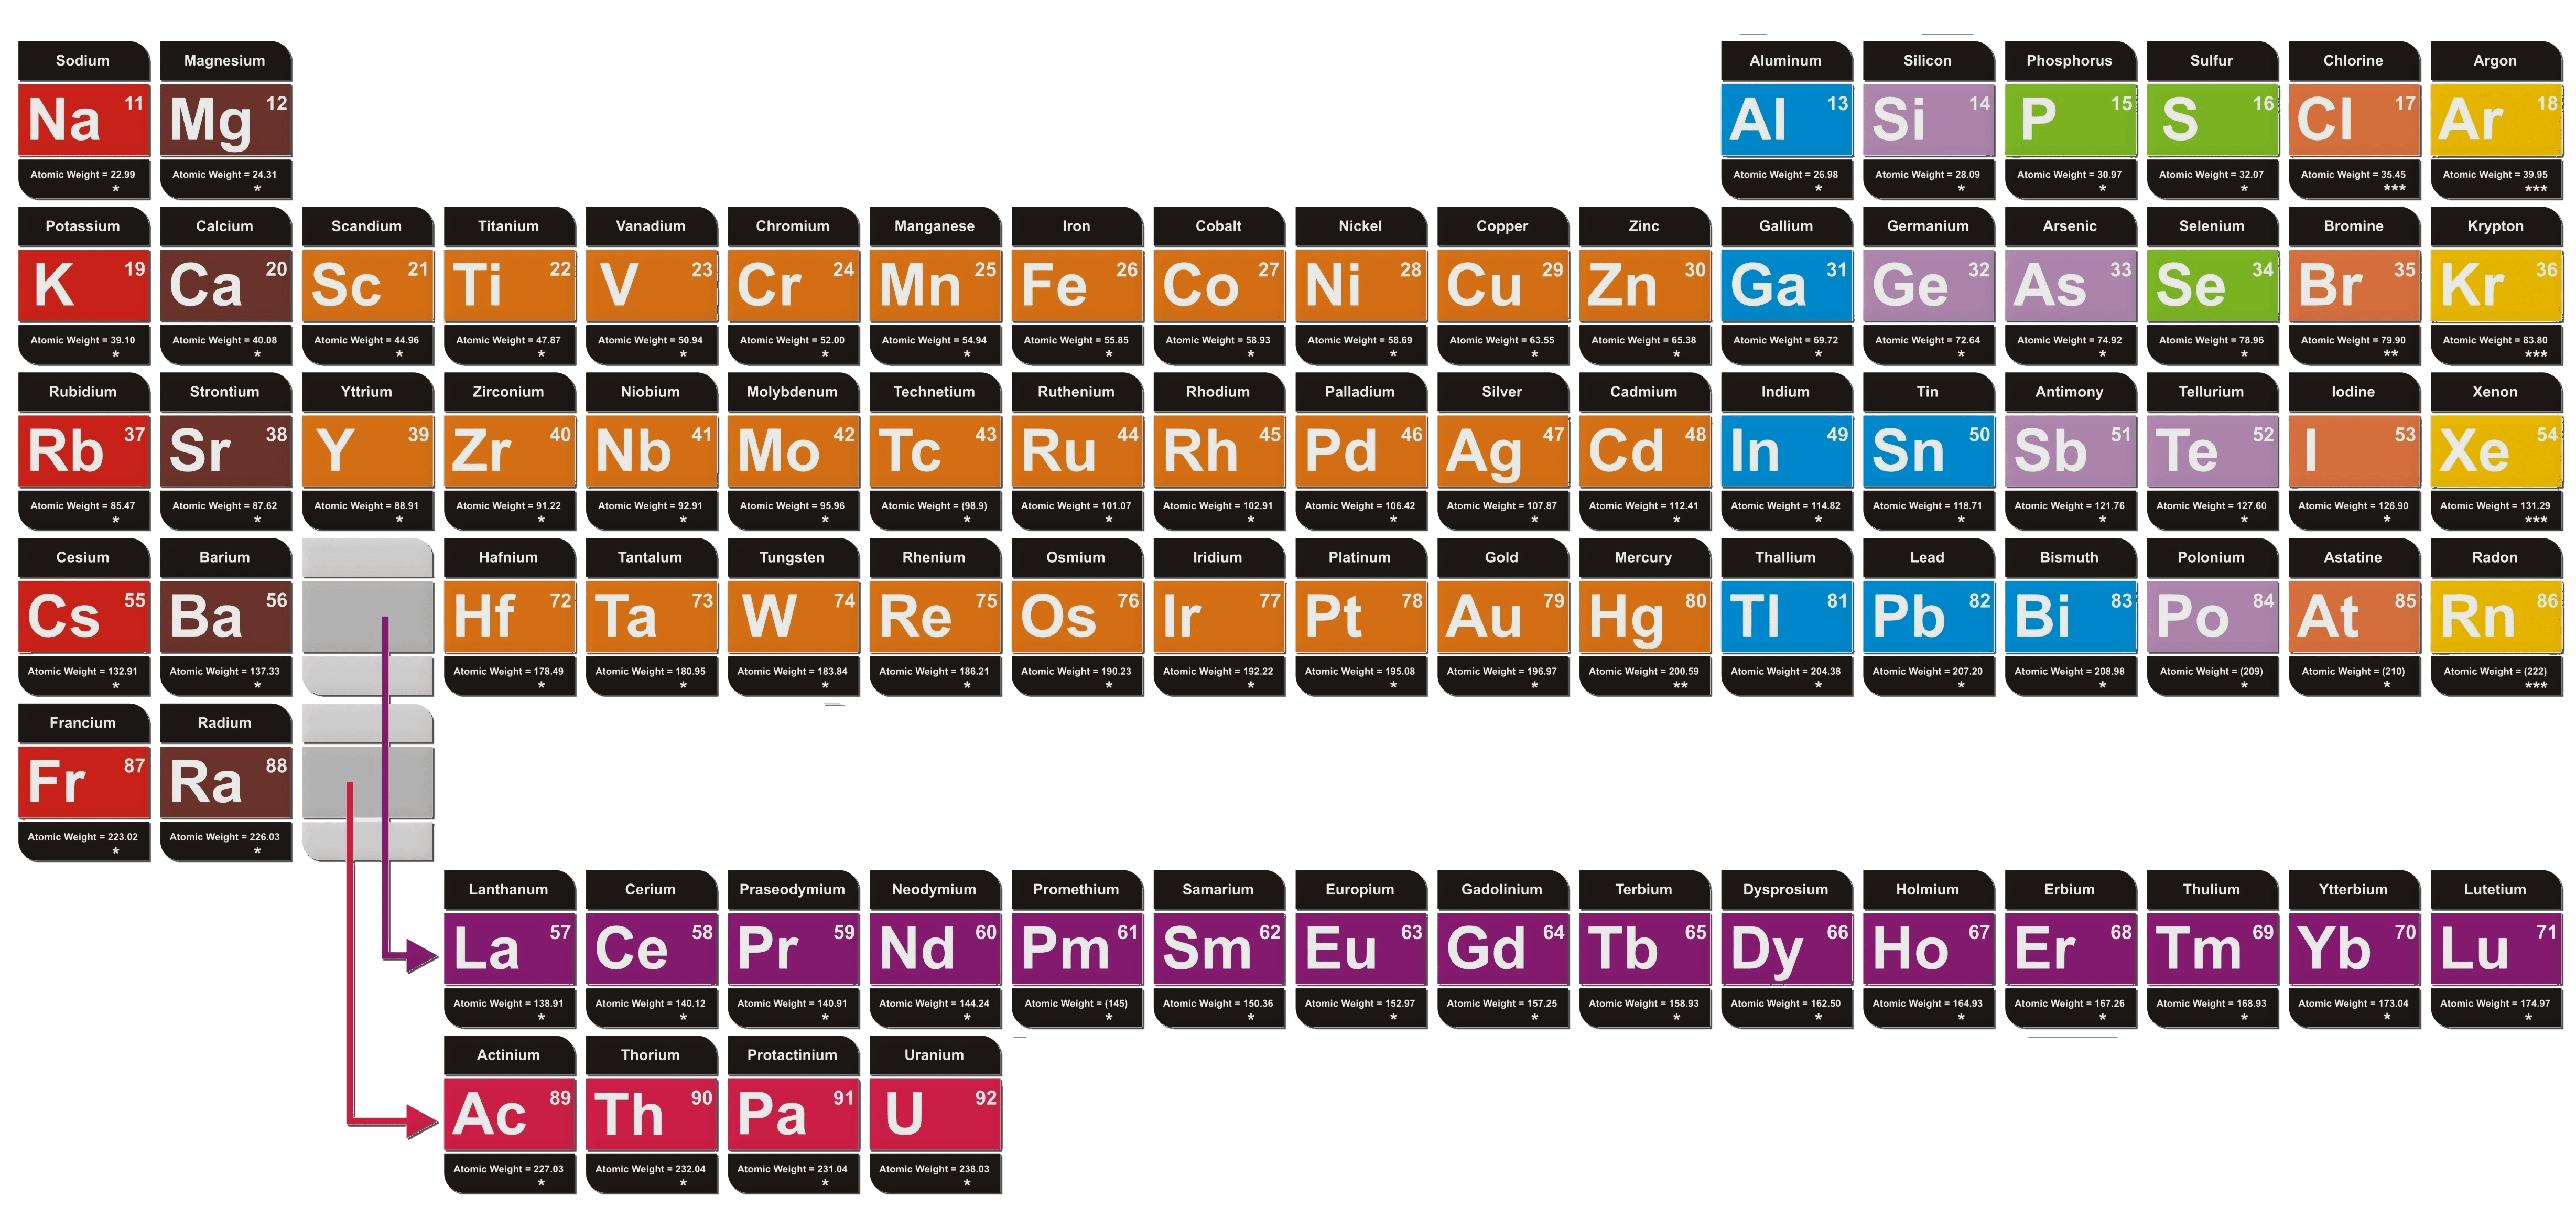
Fluorine (F) through Americium (Am). Carbon (C) through Americium (Am) on the LE version of Atlas
Sample types:
Solids, liquids, particles, powders and thin films
Sample chamber size:
508 x 457 x 254 mm (20 x 18 x 10 inches)
Analysis atmosphere:
Air, vacuum or He(g) purge
Primary X-ray source:
50 W max power, 50 kV @ 1 mA
Optional secondary X-ray source:
4-12 W max power, 40-60 kV @ 0.4-1 mA
X-ray source optics:
Polycapillary or aperture collimation
X-ray source anode:
Rhodium (others optionally available)
X-ray source spot size (primary):
5 μm standard (optional: 10, 15, 20, 25, 40 or 100 μm)
X-ray source filters:
Up to 7 plus an open position
Primary X-ray source geometry:
Top-down beam (perpendicular to sample stage)
Detector(s):
1 standard, optionally up to a maximum of 4
Detector types:
Silicon drift detector (SDD) with Graphine windows
Detector active area:
30 to 65 mm2, up to 260 mm2 w/ 4 detectors
Sample stage type:
Motorized X, Y, and Z
Sample stage travel:
320(W) x 320(D) x 210(H) mm
Mapping travel:
220(X) x 200(Y) mm
Mapping scan speed:
1-3 ms/pixel
Stage XY speed:
Up to 300 mm/s
Sample view:
3 cameras for sample positioning and analysis
Operating system:
SFF PC w/ Microsoft® Windows™ 11 OS
Analysis and control software:
Iridium Ultra: provides complete control of parameters, filters, cameras, optical microscopes, sample illumination and positioning, and measurement media
Quality and safety:
CE marked, RoHS, radiation < 0.5 μSv/h
Dimensions:
890(L) x 560(W) x 560(H) mm (35 x 22 x 22 inches)
Power:
100-240 V, 1 phase, 50/60 Hz
Periodic table
Quantify elements from carbon (C) through uranium (U)
In any sample type: solids, liquids, powders, particles, and thin films
From low parts-per-million (PPM) to 100 wt.%
Hyperspectral microscopic imaging
where every pixel is a complete spectrum
Mapping, linescans, multi-poin,t and single-point quantification
Phytomining / agromining
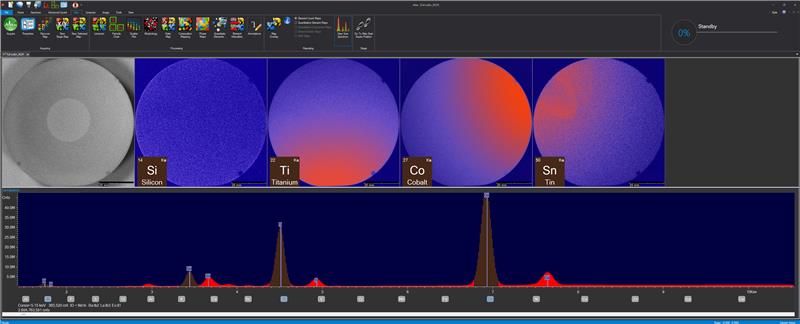
Elemental mapping of hydrated plant tissue
From heavy metals to REEs
Identify and quantify hyper-accumulation
In situ analysis ready, with feedthroughs that enable other measurement modalities
Life sciences
Hyperspectral XRF microscopy
From anatomy to biology to botany and beyond
100% Nondestructive
Unlike a SEM, there is no coating or sample prep
Works with non-conductive samples
Automatically produce quantitative analysis for each pixel
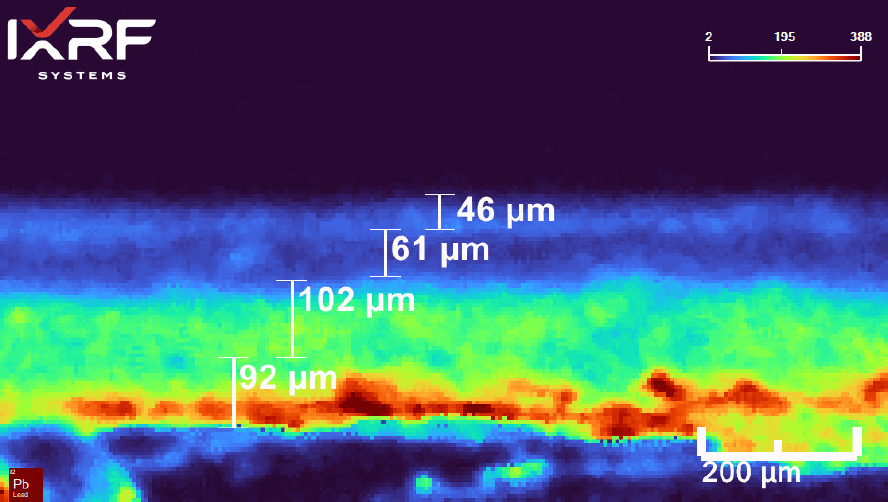
Forensics for paint chips
Very powerful forensic tool capable of single or multi-spot analysis
To identify distribution of elements within a sample
Paint chip and paint layer analysis is a common forensic application
Differentiate closely related samples
By the coating, paint, or base coat in any combination
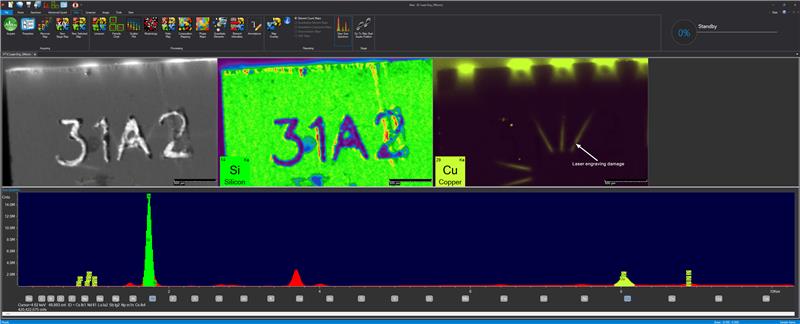
Circuit board inspection
Fast X-ray mapping for electronics’ inspections
A complete X-ray Spectrum for each pixel in the map
Measure thin gold and palladium coatings on PCBs
Measure coating thickness of Cu, Ni, etc.
Measure solder composition
RoHS / WEEE compliance
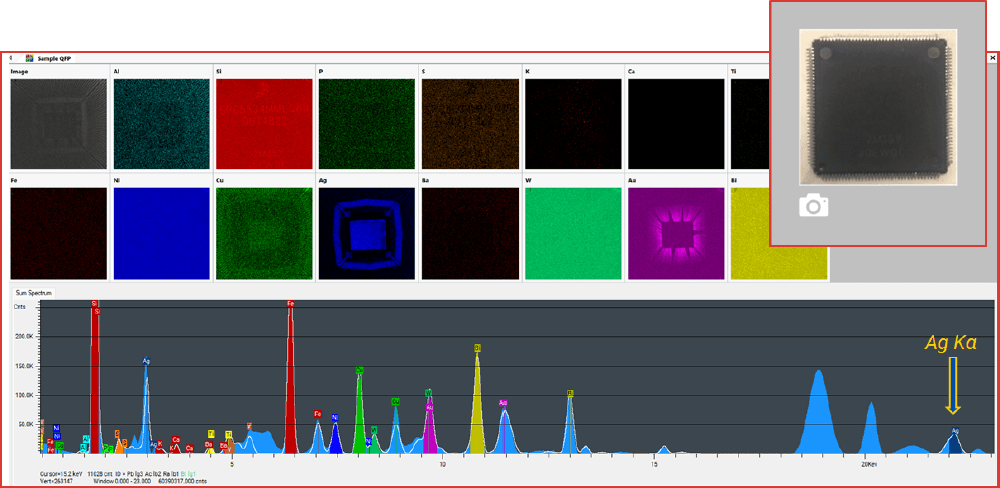
Lead frame imaging
Measurements on very small flat components and structures such as conducting paths, contacts or lead frames
Measurements of typical multi-coating systems on lead frames,e.g., AuAg/Pd/Ni/CuFe or Au/Pd/Ni/CuFe in the nanometer range
Determination of the phosphorous content in NiP coatings
Measurements of functional coatings in the electronics and semiconductor industries
Determination of complex multi-coating systems
Wafer metrology
Sn/Ag Bump/Pillar measurements
Light elements
Metal film stack composition such as CIGS
Cu CMP control at BEOL
Multi-stack structures
Sputtering targets
Thermal barrier coating
Thickness and composition control
Pharmaceuticals
Trace XRF spectrometry mapping at 5 microns
Trace analysis of metal impurities and inclusions
Non-destructive elemental analysis
Quality control / quality assurance
Particle analysis
Distribution and/or phase analysis
Soils and drilling cores
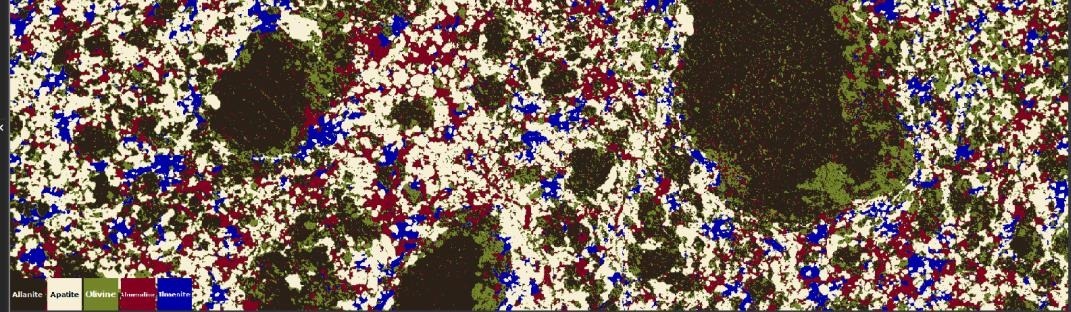
Quick phase maps using Principal Components Analysis (PCA)
Map samples automatically in minutes
No sample preparation
Mineral identification capabilities (including a library of over 4000 minerals)
Phase boundaries
Metals & alloys
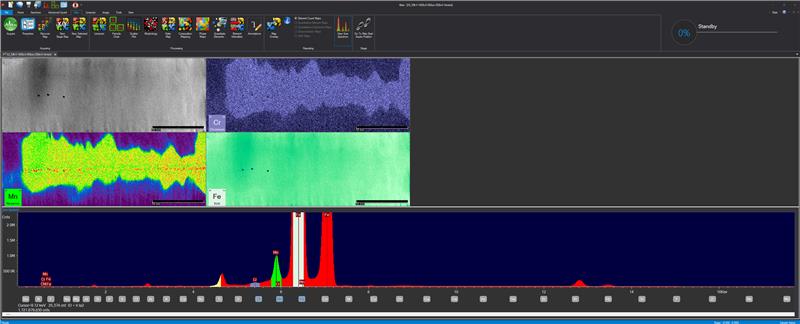
Advanced continuously cast high strength low alloy steels are often subject to elemental segregation along the billet or slab centerline
Rapidly scan centerline areas and quantitatively monitor elemental inhomogeneity
Of particular interest is manganese (Mn) which is the primary hardening agent that can easily be measured in an air environment
Other segregating elements of interest include: Cr, Ni, Mo, S, P, Al and Si
Geology
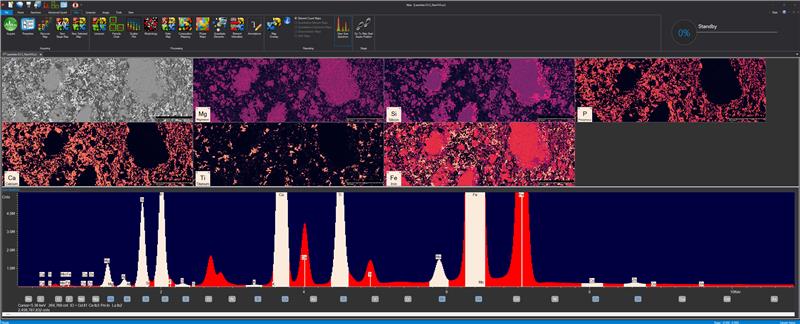
Small spot, microEDXRF expands the abilities of a geologist. Micro-XRF is ideally suited for the analysis of inorganic species, and offers excellent sensitivity to trace elements and phases
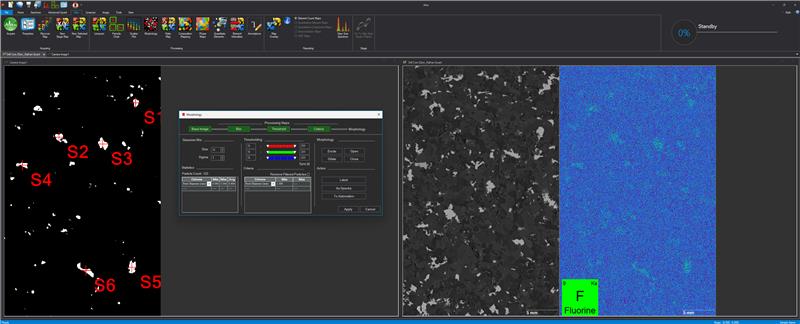
Point analysis allows fast identification of mineral phases, even when analyzing individual grains from crushed rock, or microscopic features in a section
XRF hyperspectral imaging provides detailed element images which highlight the distribution of mineral phases, illustrating the general rock structure
• Geological thin slices
• Mineral identification
• Phase boundaries
• Meteorites
• Volcanic material
• Sediment cores
• Mining test cores
• Mining exploration
• Gemstones
Cement & aggregate
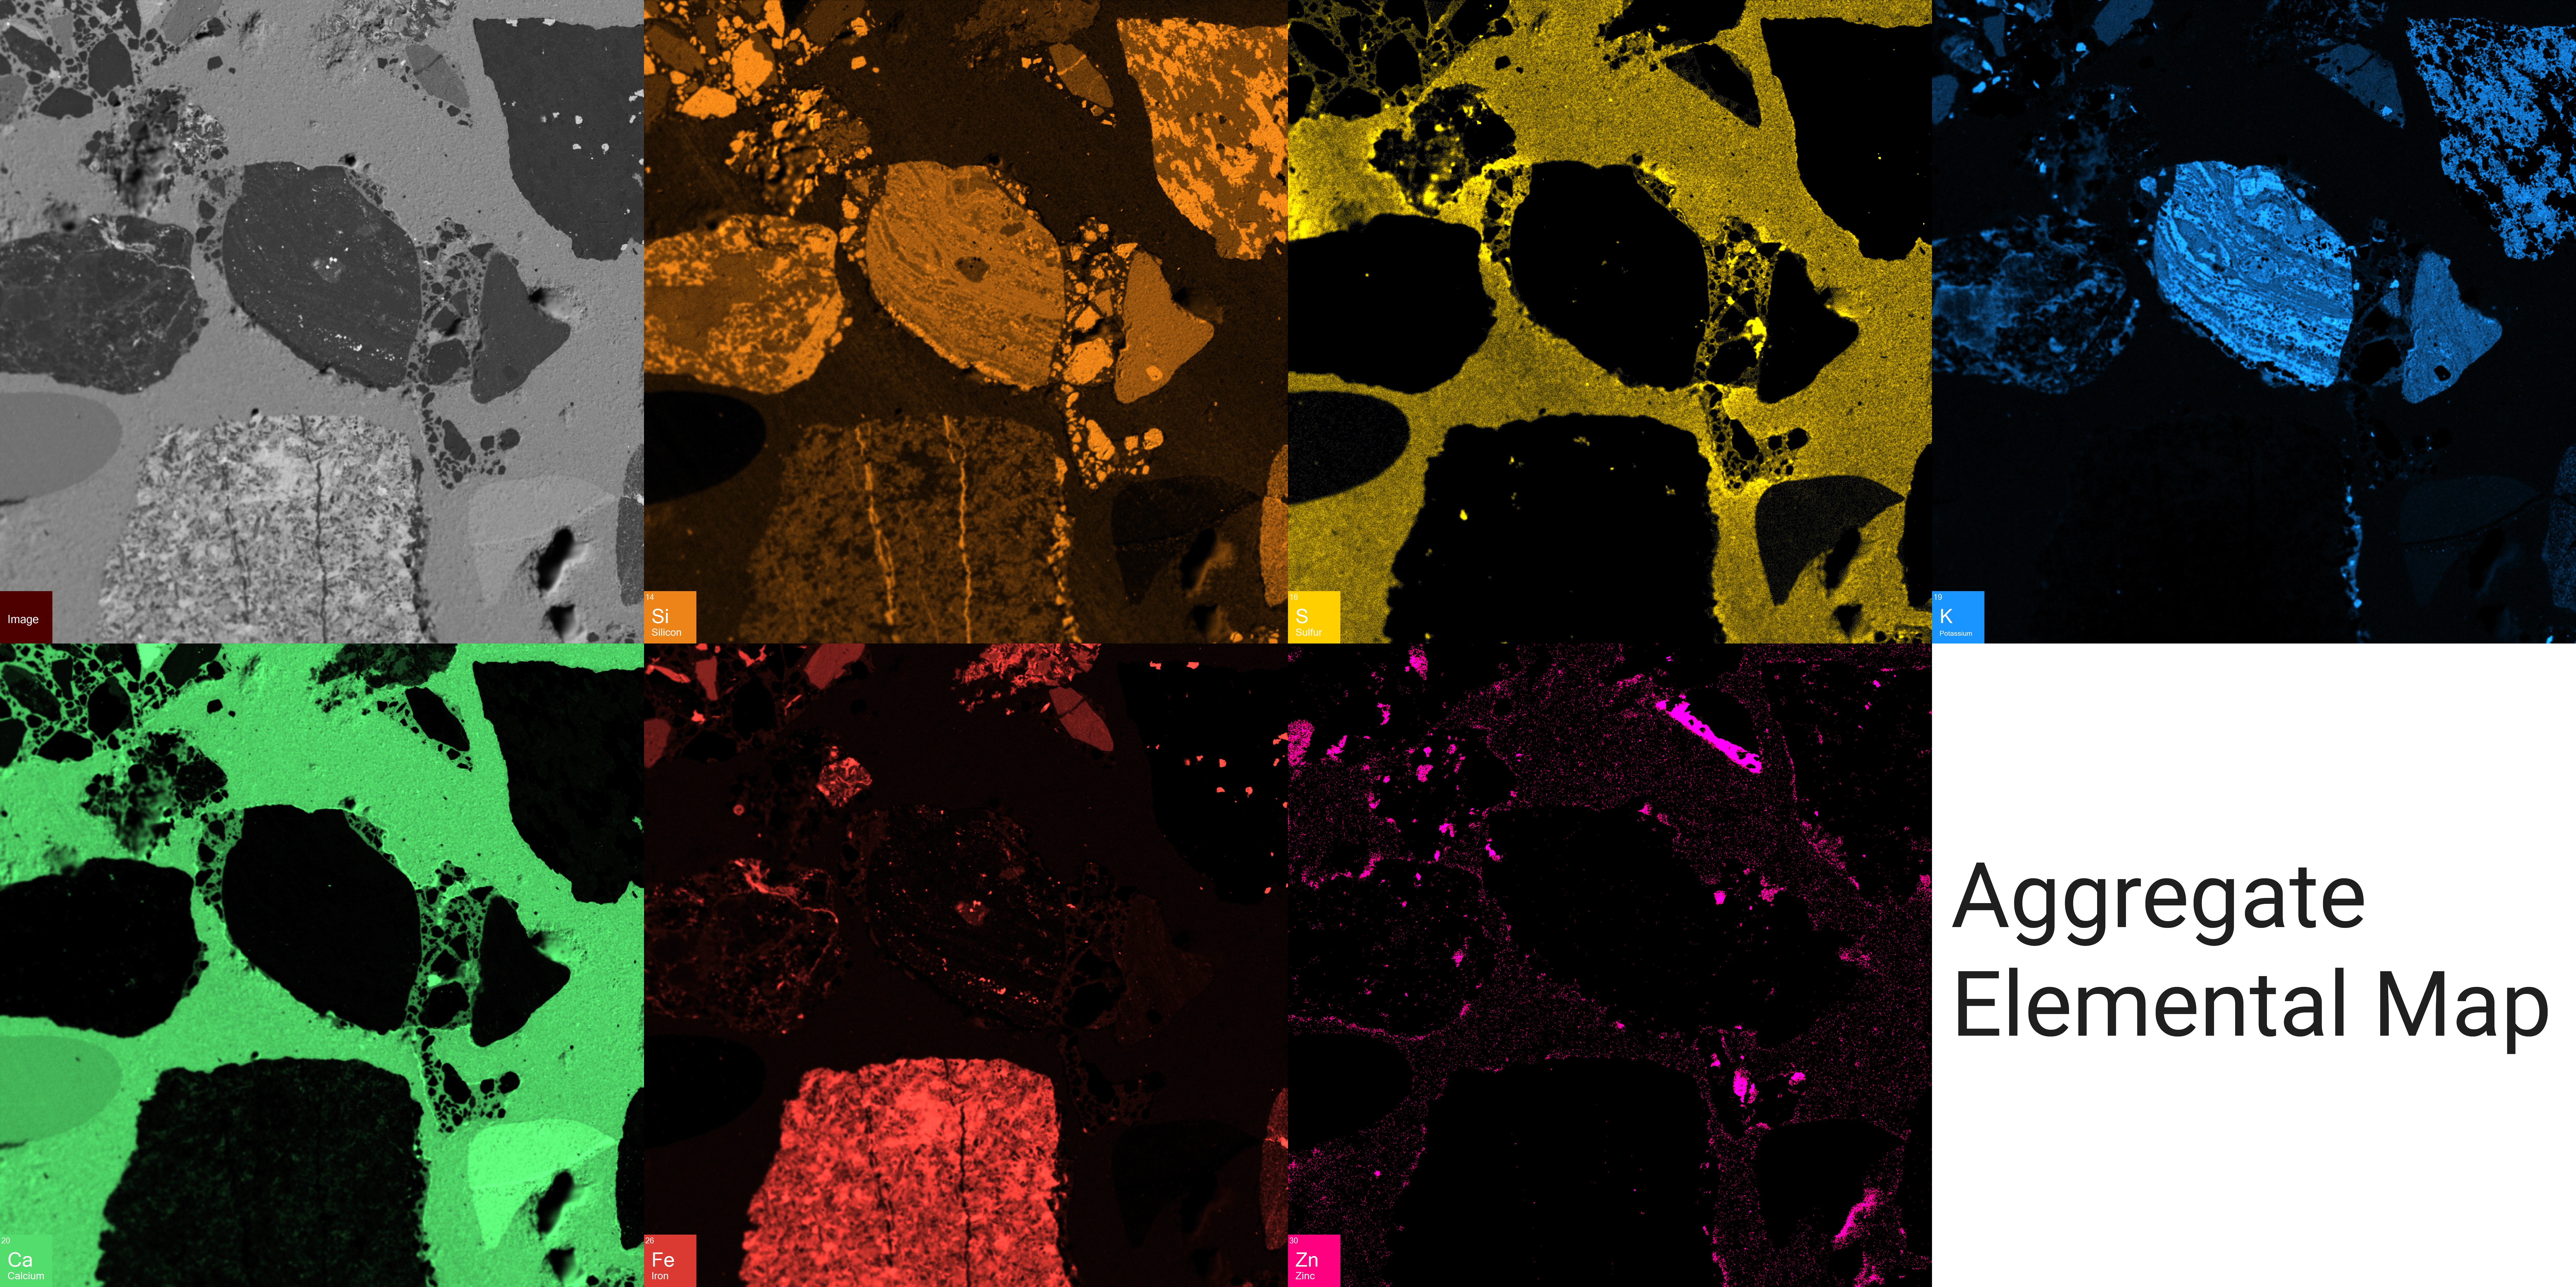
Elemental mapping of concrete and cements may be performed with ATLAS Apex providing the analyst with the opportunity to visually and chemically inspect the physical sample
XRF is the established technique to control the quality and conformity of the final cement product
Phase mapping of concrete cores provides quantitative aggregate distribution data
RoHS / WEEE
With stage mapping, large samples can be quickly mapped for the identification of prohibited materials
It is not necessary to know what elements are present before collecting a map
Elements can be added as the spectrum grows and peaks become evident
The Atlas Apex M offers one of the largest sample chambers in the industry
Archaeometry
Sensitive and valuable archaeological objects can be easily and reliably analyzed with the ATLAS Apex microXRF spectrometer
The microEDXRF (μXRF) technique permits a fast non-destructive analysis of objects, especially on small sample areas
Atlas Apex M allows low-Z elements of large objects to be analyzed
CIGS solar cells
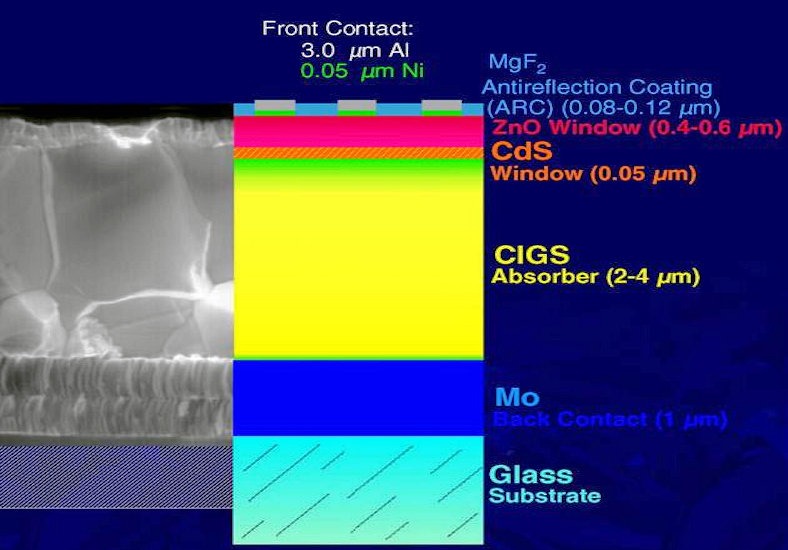
Analysis of thin film photovoltaic cells is commonly performed with microXRF
With ATLAS Apex, it is possible to measure structures under vacuum for superior results
For in-line control during the production process as well as for final testing
Quantification for layer thicknesses are in very good agreement with WDXRF results
Do, Christina, Farida Abubakari, Amelia Corzo Remigio, Gillian K. Brown, Lachlan W. Casey, Valérie Burtet-Sarramegna, Vidiro Gei, Peter D. Erskine, and Antony van der Ent. “A Preliminary Survey of Nickel, Manganese and Zinc (Hyper)Accumulation in the Flora of Papua New Guinea from Herbarium X-Ray Fluorescence Scanning.” Chemoecology 30, no. 1 (February 1, 2020): 1–13. https://doi.org/10.1007/s00049-019-00293-1.
Ent, Antony van der, Peter M. Kopittke, David J. Paterson, Lachlan W. Casey, and Philip Nti Nkrumah. “Distribution of Aluminium in Hydrated Leaves of Tea ( Camellia Sinensis ) Using Synchrotron- and Laboratory-Based X-Ray Fluorescence Microscopy.” Metallomics 12, no. 7 (2020): 1062–69. https://doi.org/10.1039/C9MT00300B.
Harvey, Maggie-Anne, Erskine, Peter D., Harris, Hugh H., Brown, Gillian K., Pilon-Smits, Elizabeth A. H., Casey, Lachlan W., Echevarria, Guillaume and van der Ent, Antony (2020). Distribution and chemical form of selenium in Neptunia amplexicaulis from Central Queensland, Australia. Metallomics 12 (4) 514-527. https://doi.org/10.1039/c9mt00244h.
Van der Ent, Antony, Casey, Lachlan W., Blamey, F. Pax C. and Kopittke, Peter M. (2020). Time-resolved laboratory µ-XRF reveals silicon distribution in relation to manganese toxicity in soybean and sunflower. Annals of Botany. https://doi.org/10.1093/aob/mcaa081.
Huang, Xitong, Yong Li, Ke Chen, Haiyan Chen, Fei Wang, Xiaomin Han, Beihai Zhou, Huilun Chen, and Rongfang Yuan. “NOM Mitigates the Phytotoxicity of AgNPs by Regulating Rice Physiology, Root Cell Wall Components and Root Morphology.” Environmental Pollution 260 (May 2020): 113942. https://doi.org/10.1016/j.envpol.2020.113942.
Jones, Michael W. M., Peter M. Kopittke, Lachlan Casey, Juliane Reinhardt, F. Pax C. Blamey, and Antony van der Ent. “Assessing Radiation Dose Limits for X-Ray Fluorescence Microscopy Analysis of Plant Specimens.” Annals of Botany 125, no. 4 (March 29, 2020): 599–610. https://doi.org/10.1093/aob/mcz195.
Le Pape, Y. “Neutron-Irradiation-Induced Damage Assessment in Concrete Using Combined Phase Characterization and Nonlinear Fast Fourier Transform Simulation.” In Proceedings of the 10th International Conference on Fracture Mechanics of Concrete and Concrete Structures. IA-FraMCoS, 2019. https://doi.org/10.21012/FC10.232765.
Li, Y., Y. Le Pape, E. Tajuelo Rodriguez, C.E. Torrence, J.D. Arregui Mena, T.M. Rosseel, and M. Sircar. “Microstructural Characterization and Assessment of Mechanical Properties of Concrete Based on Combined Elemental Analysis Techniques and Fast-Fourier Transform-Based Simulations.” Construction and Building Materials 257 (October 2020): 119500. https://doi.org/10.1016/j.conbuildmat.2020.119500.
Pearson, Charlotte, Matthew Salzer, Lukas Wacker, Peter Brewer, Adam Sookdeo, and Peter Kuniholm. “Securing Timelines in the Ancient Mediterranean Using Multiproxy Annual Tree-Ring Data.” Proceedings of the National Academy of Sciences 117, no. 15 (April 14, 2020): 8410–15. https://doi.org/10.1073/pnas.1917445117.
Ye, Hui, Changzhi Wu, Matthew J. Brzozowski, Tao Yang, Xiangping Zha, Shugao Zhao, Bingfei Gao, and Weiqiang Li. “Calibrating Equilibrium Fe Isotope Fractionation Factors between Magnetite, Garnet, Amphibole, and Biotite.” Geochimica et Cosmochimica Acta 271 (February 2020): 78–95. https://doi.org/10.1016/j.gca.2019.12.014.
Zhang, Mingyuan, Jianxiang Wang, and Li-Hua Shao. “Ultrahigh Flexoelectricity of 3D Interconnected Porous PDMS.” ArXiv:2009.03847 [Physics], September 27, 2020. http://arxiv.org/abs/2009.03847.
Ziejewska, Celina, Joanna Marczyk, Aneta Szewczyk-Nykiel, Marek Nykiel, and Marek Hebda. “Influence of Size and Volume Share of WC Particles on the Properties of Sintered Metal Matrix Composites.” Advanced Powder Technology 30, no. 4 (April 1, 2019): 835–42. https://doi.org/10.1016/j.apt.2019.01.013.