🧠TL;DR
Lab-based micro-XRF lets you see where key metals (Fe, Cu, Zn, Mn) live inside brain tissue—non-destructively and at micrometer scale. Those spatial patterns matter: iron, copper, and zinc hotspots co-localize with hallmarks of Alzheimer’s and Parkinson’s. IXRF Systems’ micro-XRF platform produces quantitative, hyperspectral maps from ppm to % levels and helps teams pre-characterize samples before precious synchrotron beam time—so every scan answers a sharper question.
Why metals in the brain deserve a map
If you’ve ever taken a multivitamin, you already know metals are essential. Inside the brain, though, they’re not sprinkled evenly like salt on fries—they form micro-neighborhoods. Zinc concentrates in synapses that encode memory. Iron supports energy metabolism but can catalyze oxidative stress when it piles up. Copper helps enzymes work but in excess has been linked to amyloid plaque chemistry.
When those delicate balances shift, risk rises for Alzheimer’s, Parkinson’s, ALS, and Huntington’s. Multiple studies show that where metals accumulate can be as important as how much is present. That’s why modern neuroscience doesn’t just measure totals; it maps distributions.
For deeper reading: Collingwood & Adams, 2017; Zhang et al., 2018; Grochowski et al., 2019.
Micro-XRF: turning hidden chemistry into clear pictures
Micro-X-ray fluorescence (micro-XRF) scans tissue with a focused X-ray beam and records the characteristic X-rays emitted by each element. The result is a hyperspectral image: every pixel contains a full spectrum, so you can quantify multiple elements at once and overlay them as color maps.
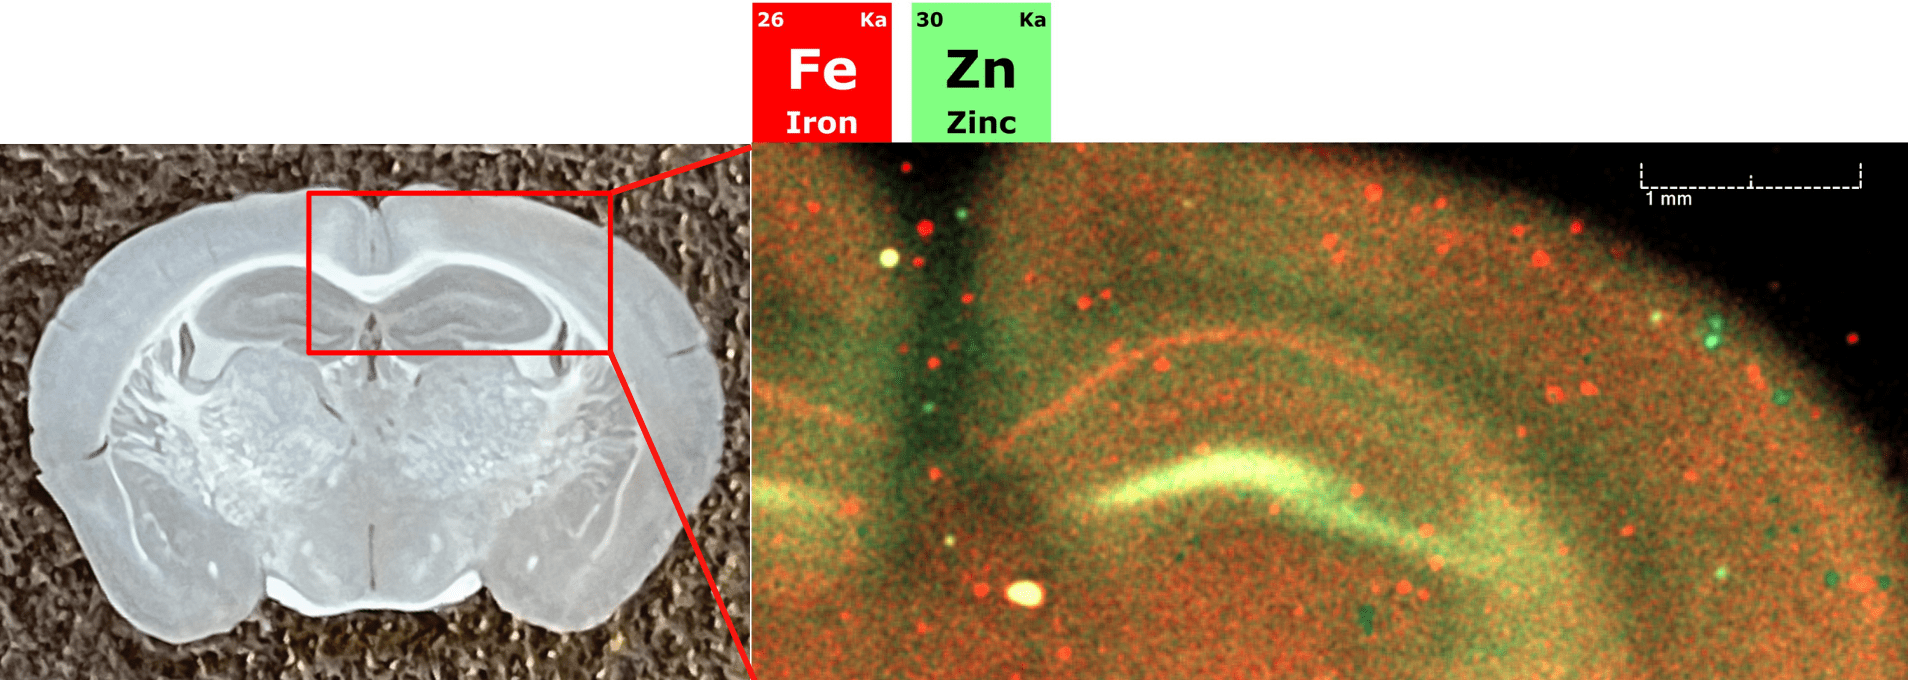
Figure 1. Micro-XRF overlay map showing spatial distributions of iron (Fe, red) and zinc (Zn, green) in mouse brain tissue. The left panel displays a full brain cross-section with a zoomed-in region of interest. The right panel reveals localized Fe and Zn concentrations within the hippocampus—an area critical to memory and learning—highlighting how IXRF’s microXRF enables elemental mapping at sub-10 µm resolution. Scale bar = 1 mm.
What you can expect from a modern lab system (IXRF Atlas Apex series)
- Resolution that matters to biology
Resolve features ≤10 µm—small enough to follow laminar structures in the hippocampus, track iron rims, or see metal gradients across a cortical layer. - Quantitative hyperspectral maps
Calibrated mapping from low-ppm to percent levels using thin-film or pressed standards. Typical ranges observed in neuro work:- Fe: ~100–800 ppm in affected regions (higher in iron-rich nuclei)
- Cu: ~50–200 ppm; local hotspots near plaques/tangles reported
- Zn: ~200–700 ppm in hippocampal circuits and plaques
- Mn / Se / P / S: often ppm-level with informative spatial trends
Maps are fully quantitative per pixel, so you can extract ROIs, histograms, and co-localization stats.
- Multi-element, one pass
Fe, Cu, Zn, Mn, P, S, Ca, K—and, where relevant, Al or Pb—are all acquired simultaneously, preserving true spatial relationships. - Non-destructive
No stains. No labels. Maintain morphology for follow-up (histology, IHC, Raman, MS imaging). Works with fresh-frozen or fixed sections; typical section thickness 10–30 µm. - At your fingertips
Because it’s lab-based, you can iterate fast: pilot screen → refine ROIs → quantitative study—without waiting for beamline cycles.
What the maps reveal for neurodegeneration
- Alzheimer’s disease (AD)
Micro-XRF pinpoints Fe, Cu, and Zn pockets in and around amyloid plaques in the hippocampus and frontal cortex. Co-maps with P/S help relate metals to protein-rich features and tissue architecture. Resolution of 5–10 µm resolves plaque edges and periplaque gradients that are hard to capture with bulk assays. - Parkinson’s disease (PD)
The substantia nigra shows iron-rich microdomains (commonly ~200–800 ppm), supporting hypotheses around iron-mediated oxidative stress. Mapping gradients across dopaminergic pathways helps distinguish focal rims from diffuse loading. - ALS
Altered Cu/Zn signatures along motor neuron tracts and ventral horn regions can be visualized without labels, enabling ROI-specific quantification and correlation with pathology scores. - Huntington’s disease (HD)
Striatal/basal ganglia iron dysregulation is measurable and mappable, offering spatial biomarkers to track therapeutic impact over time.
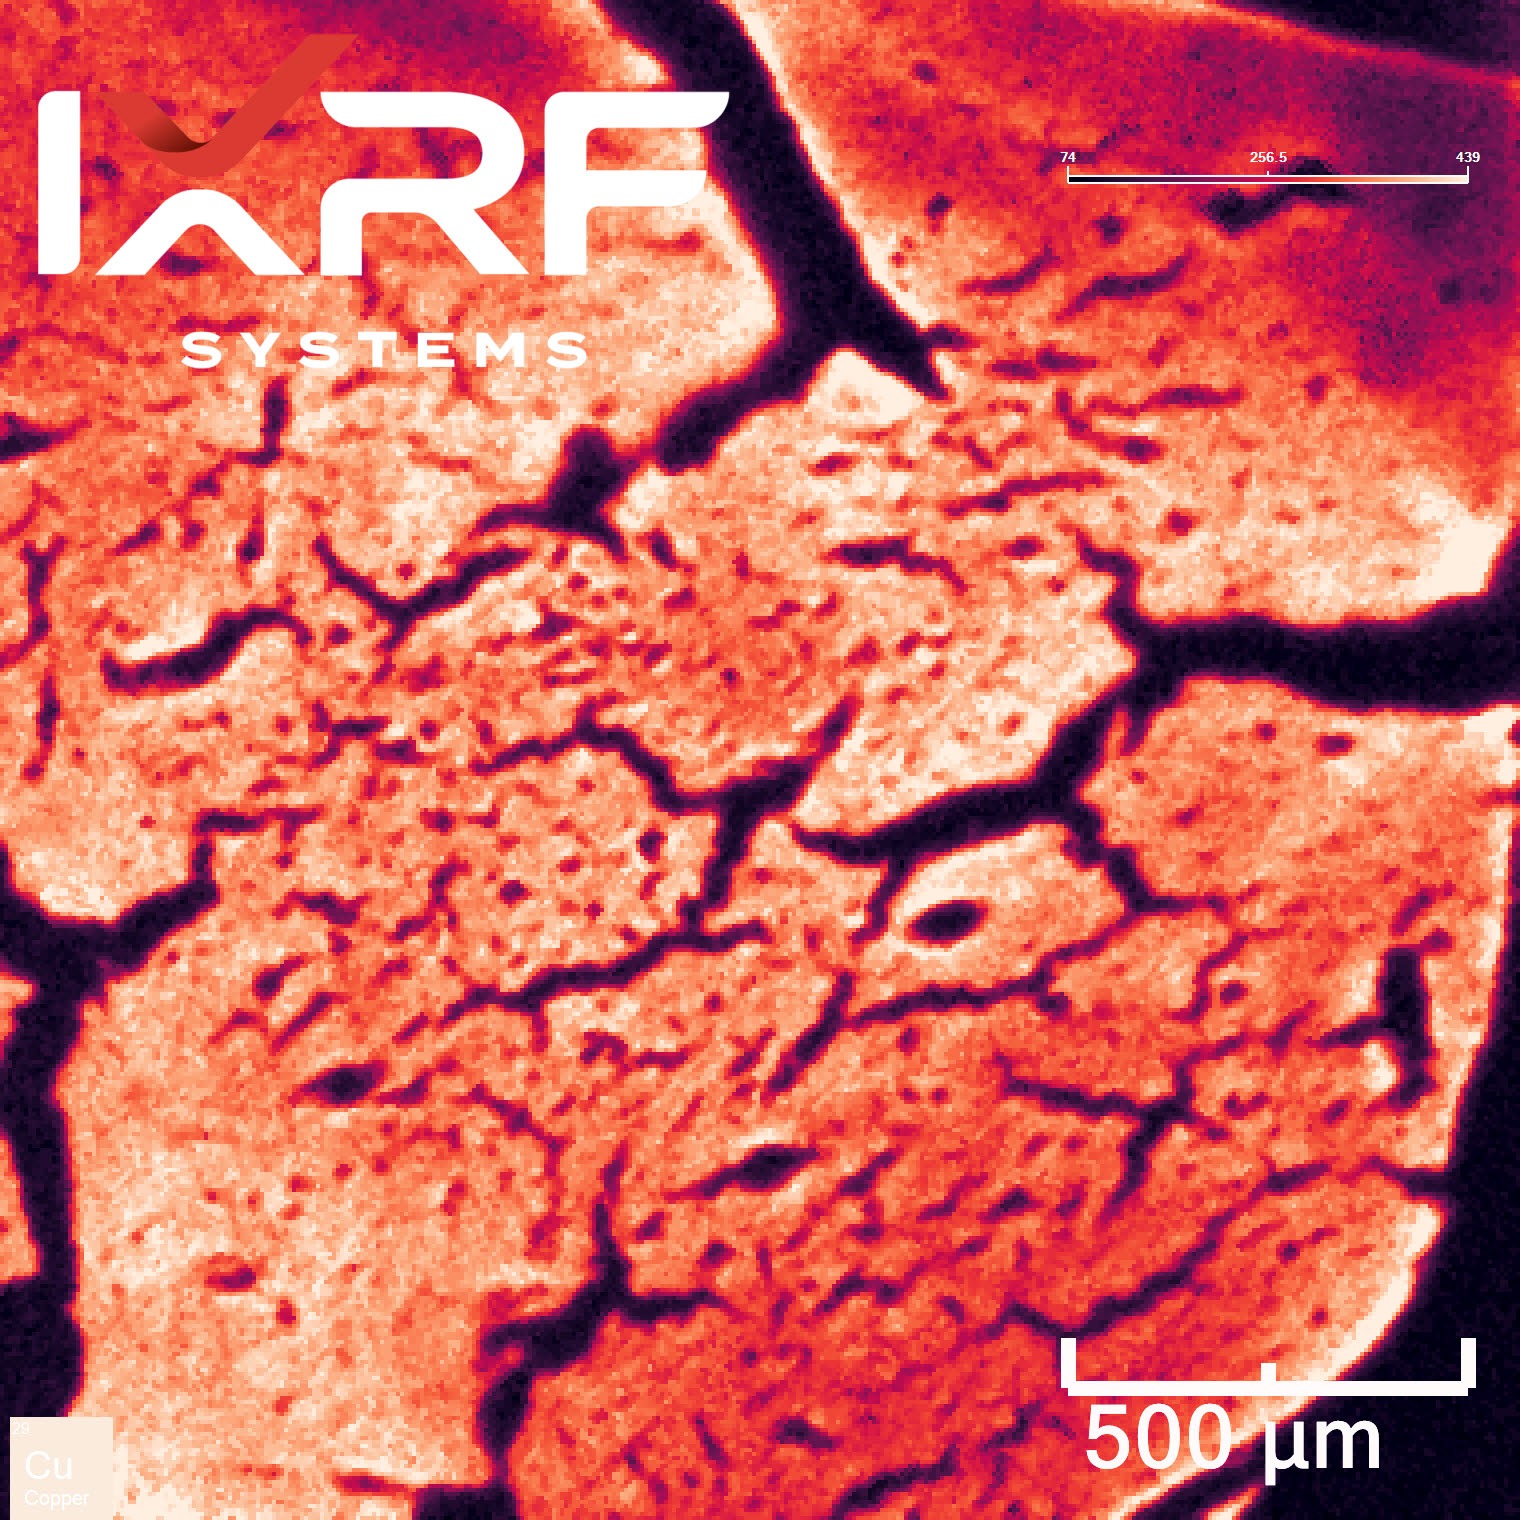
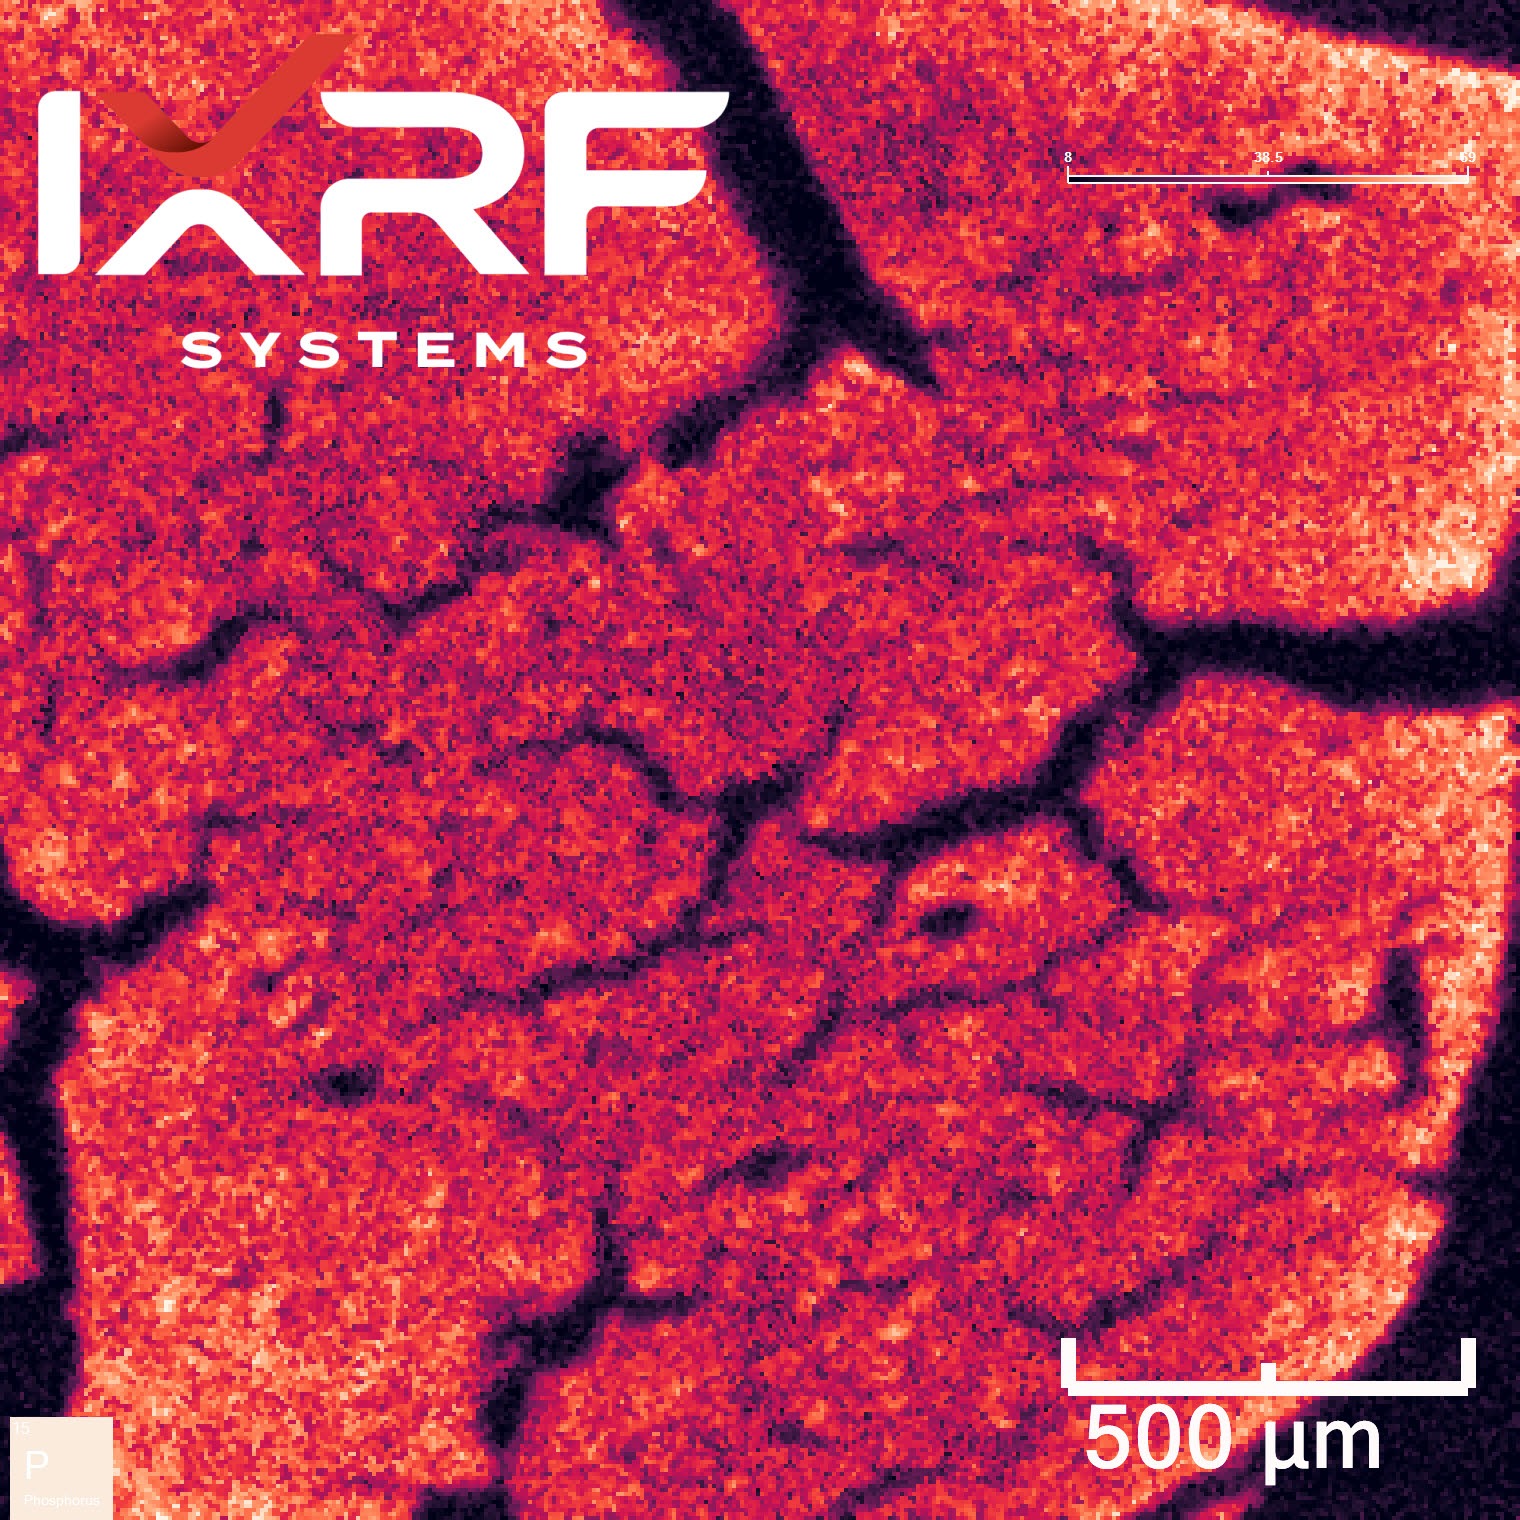
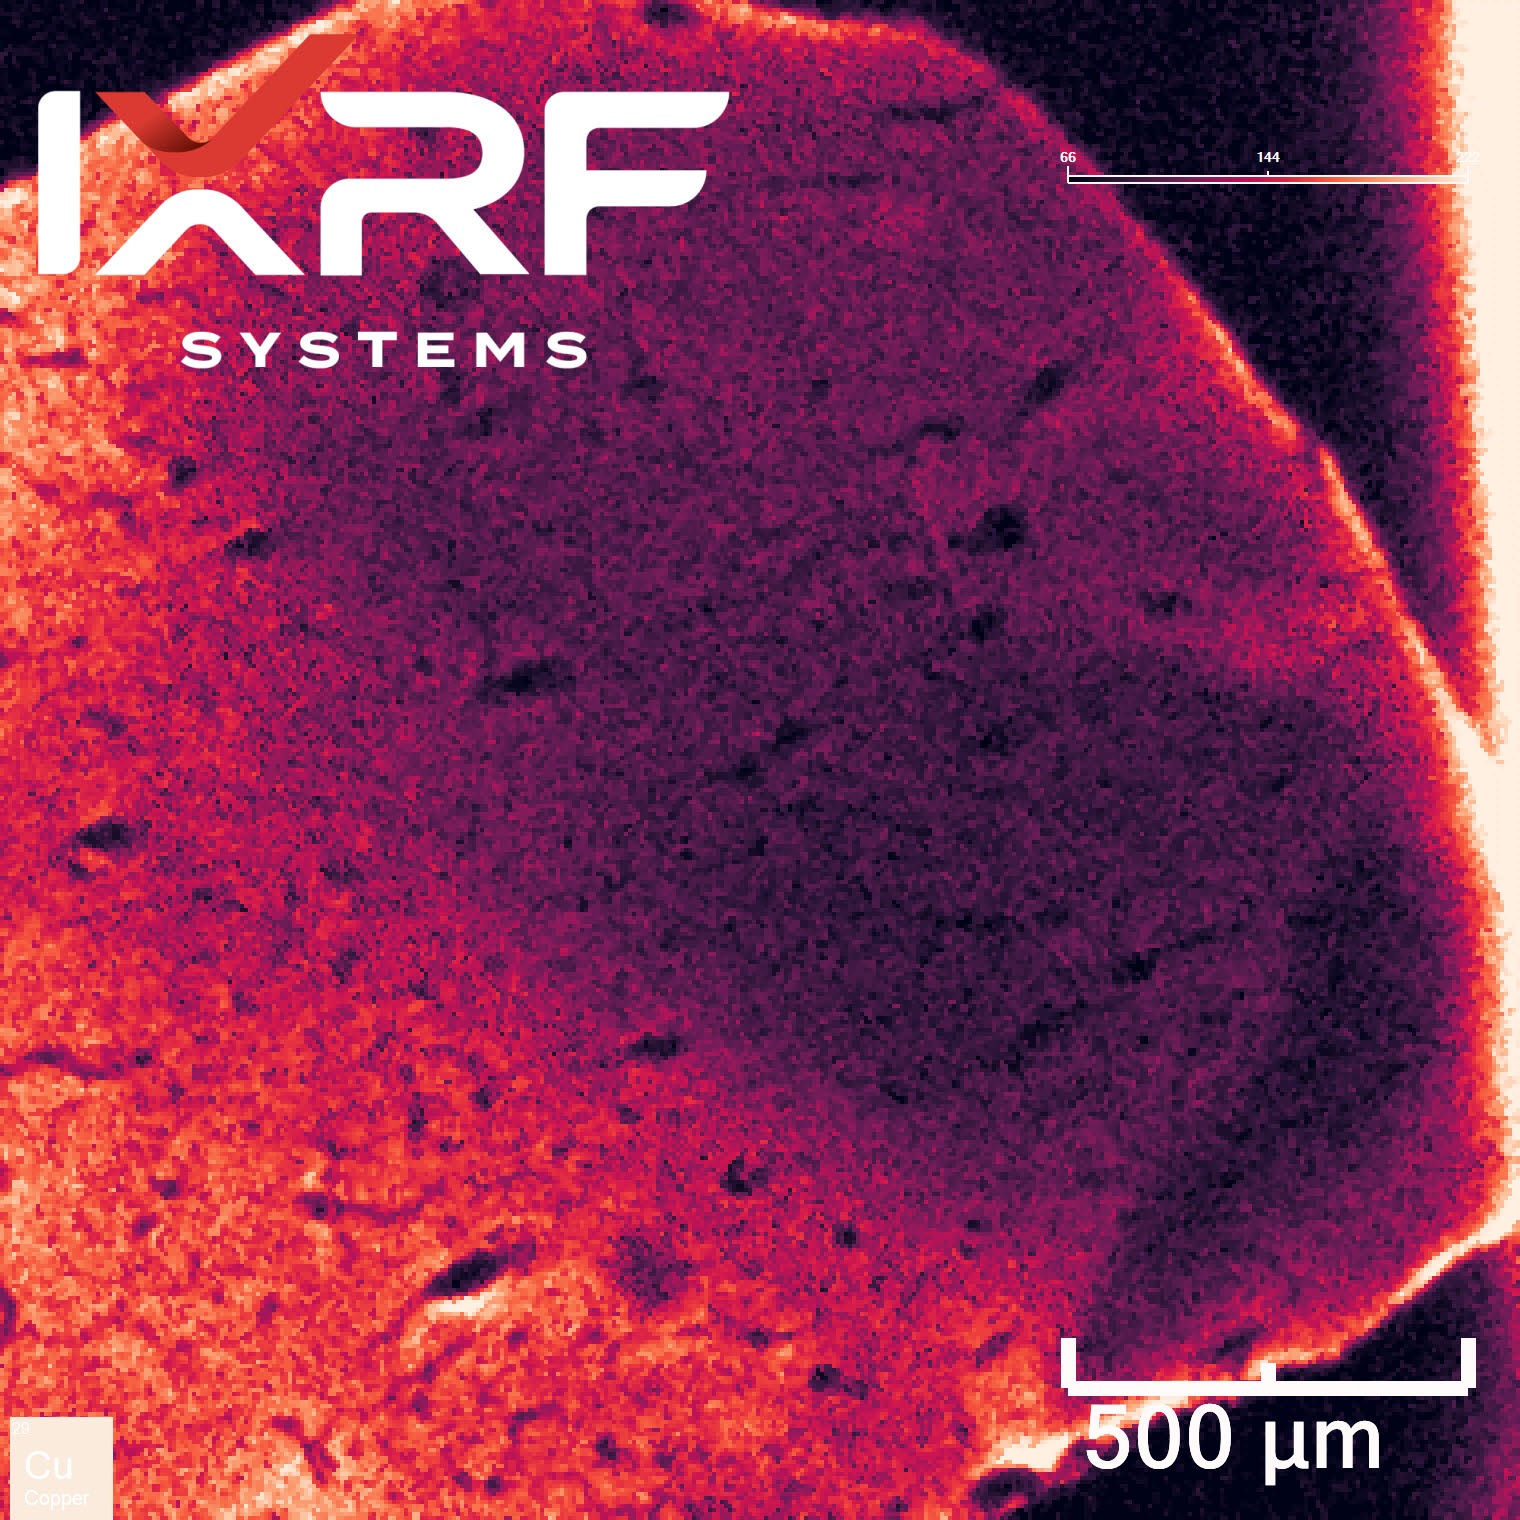
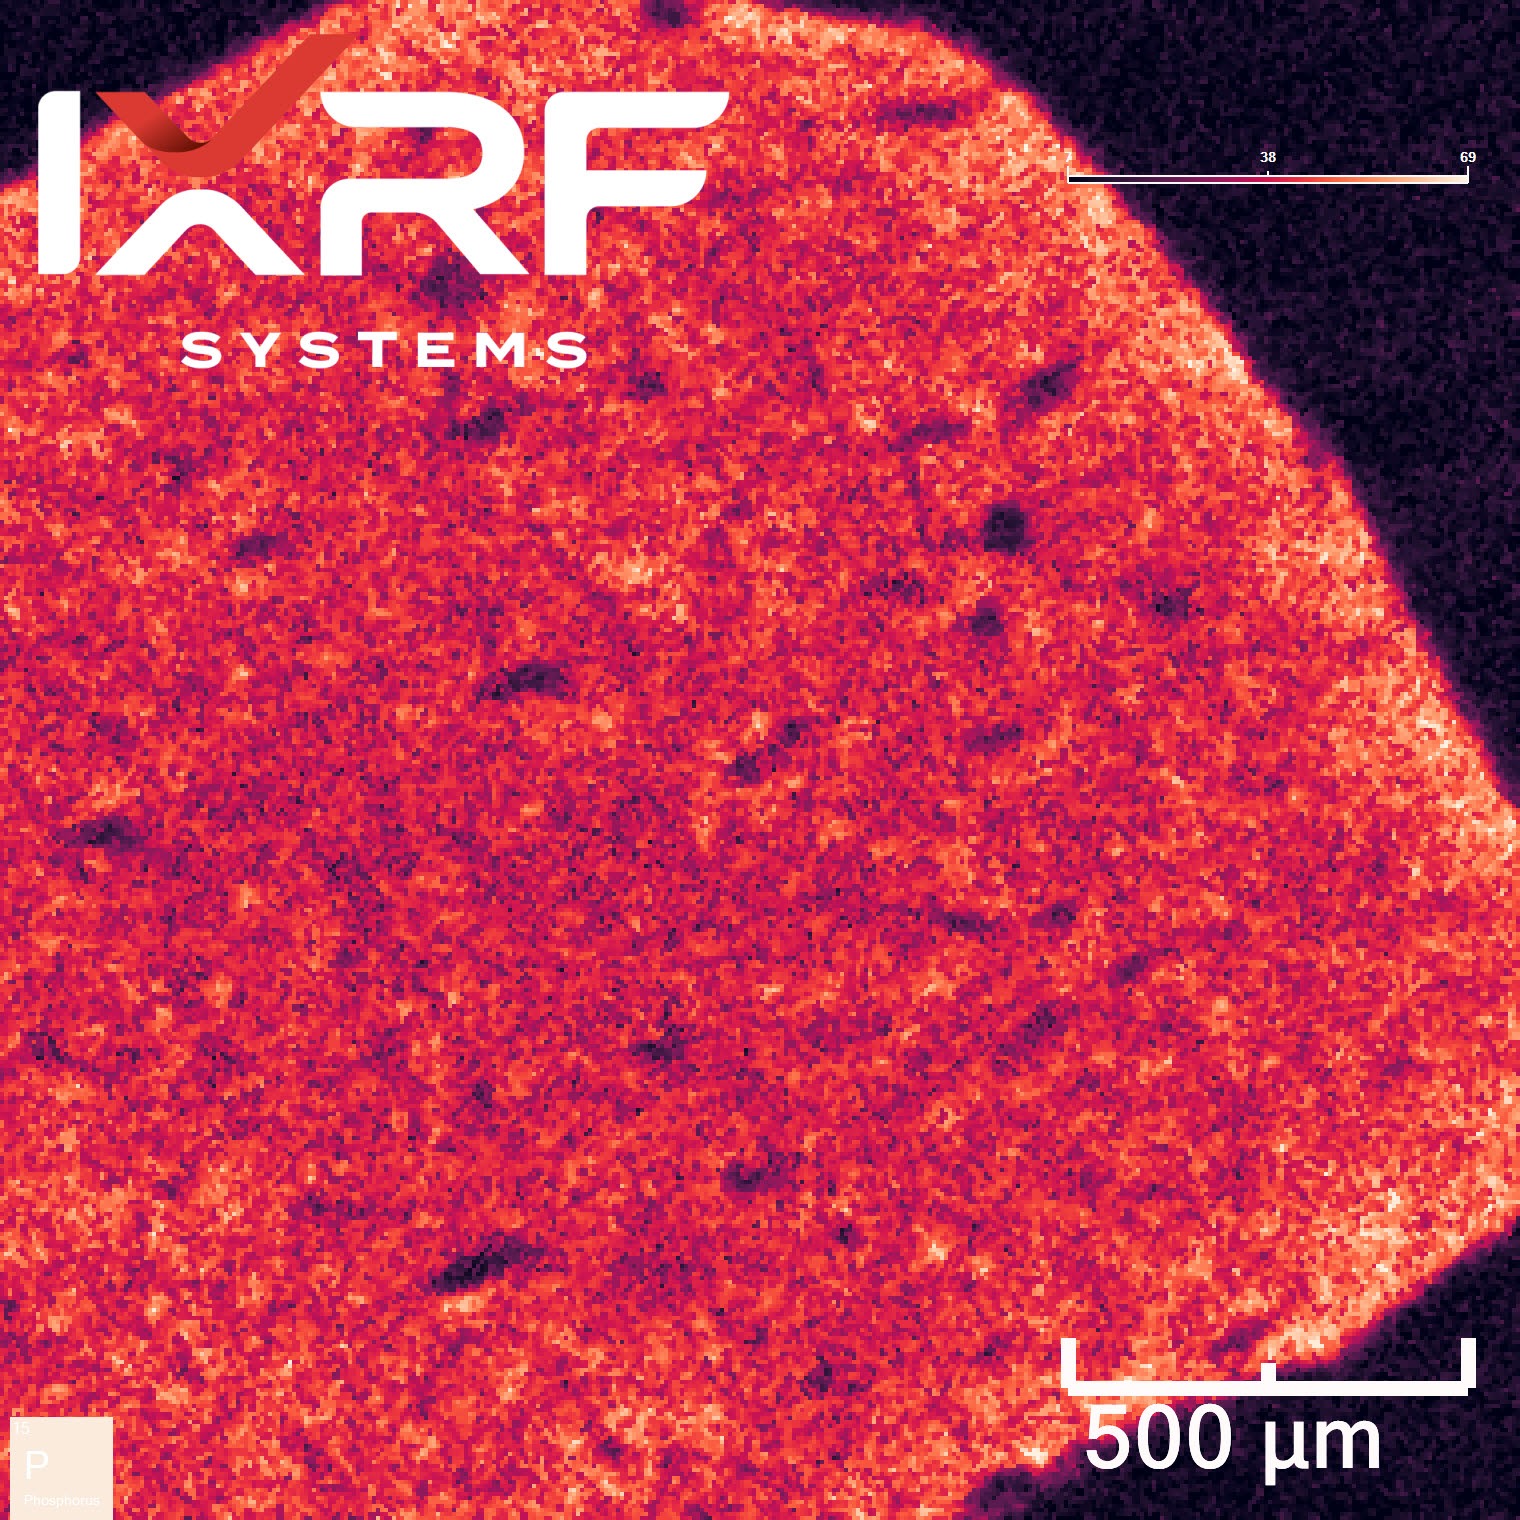
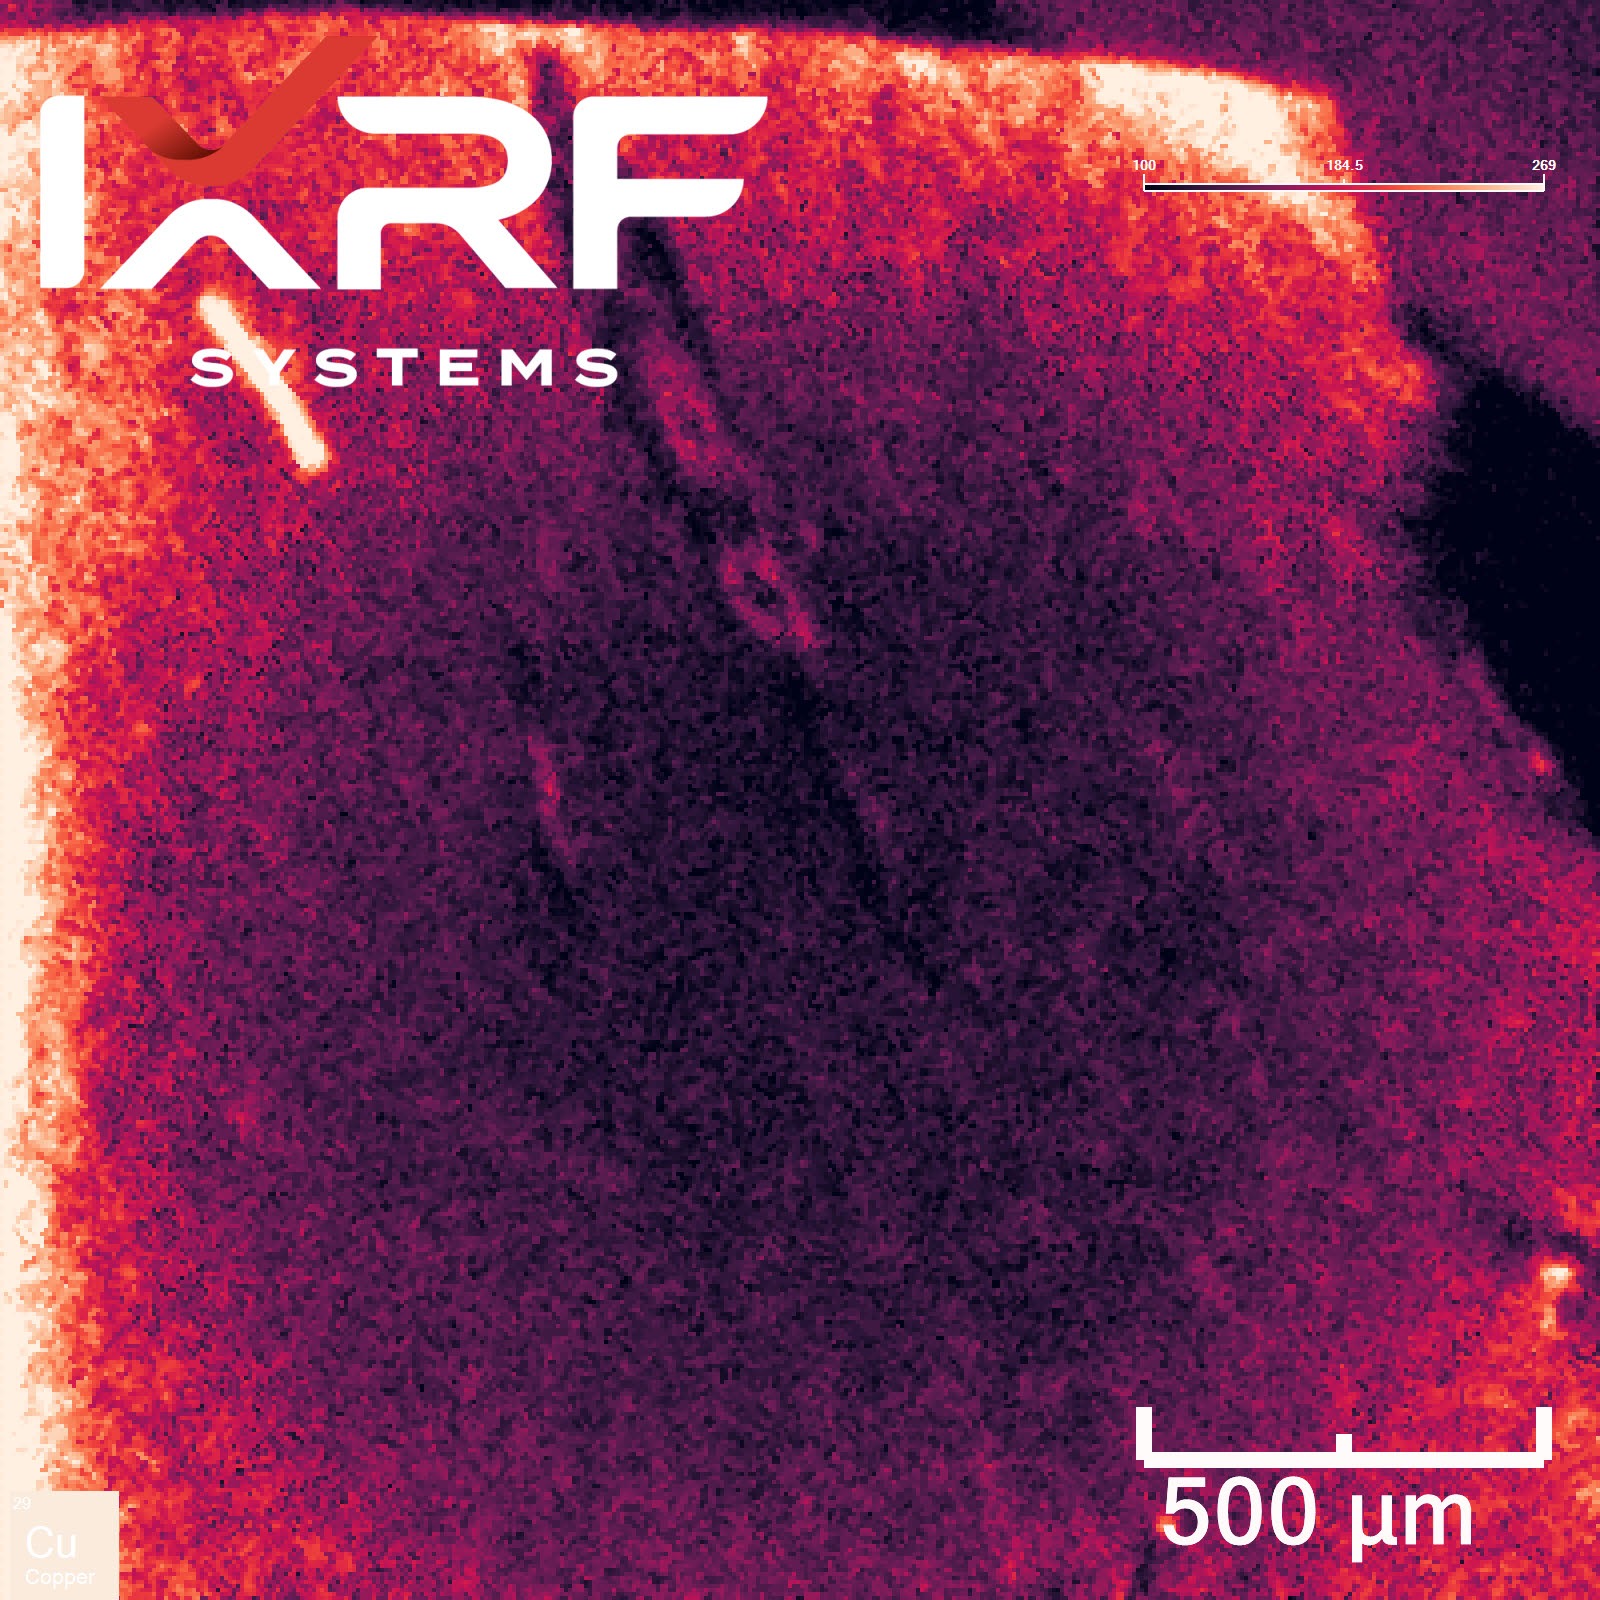
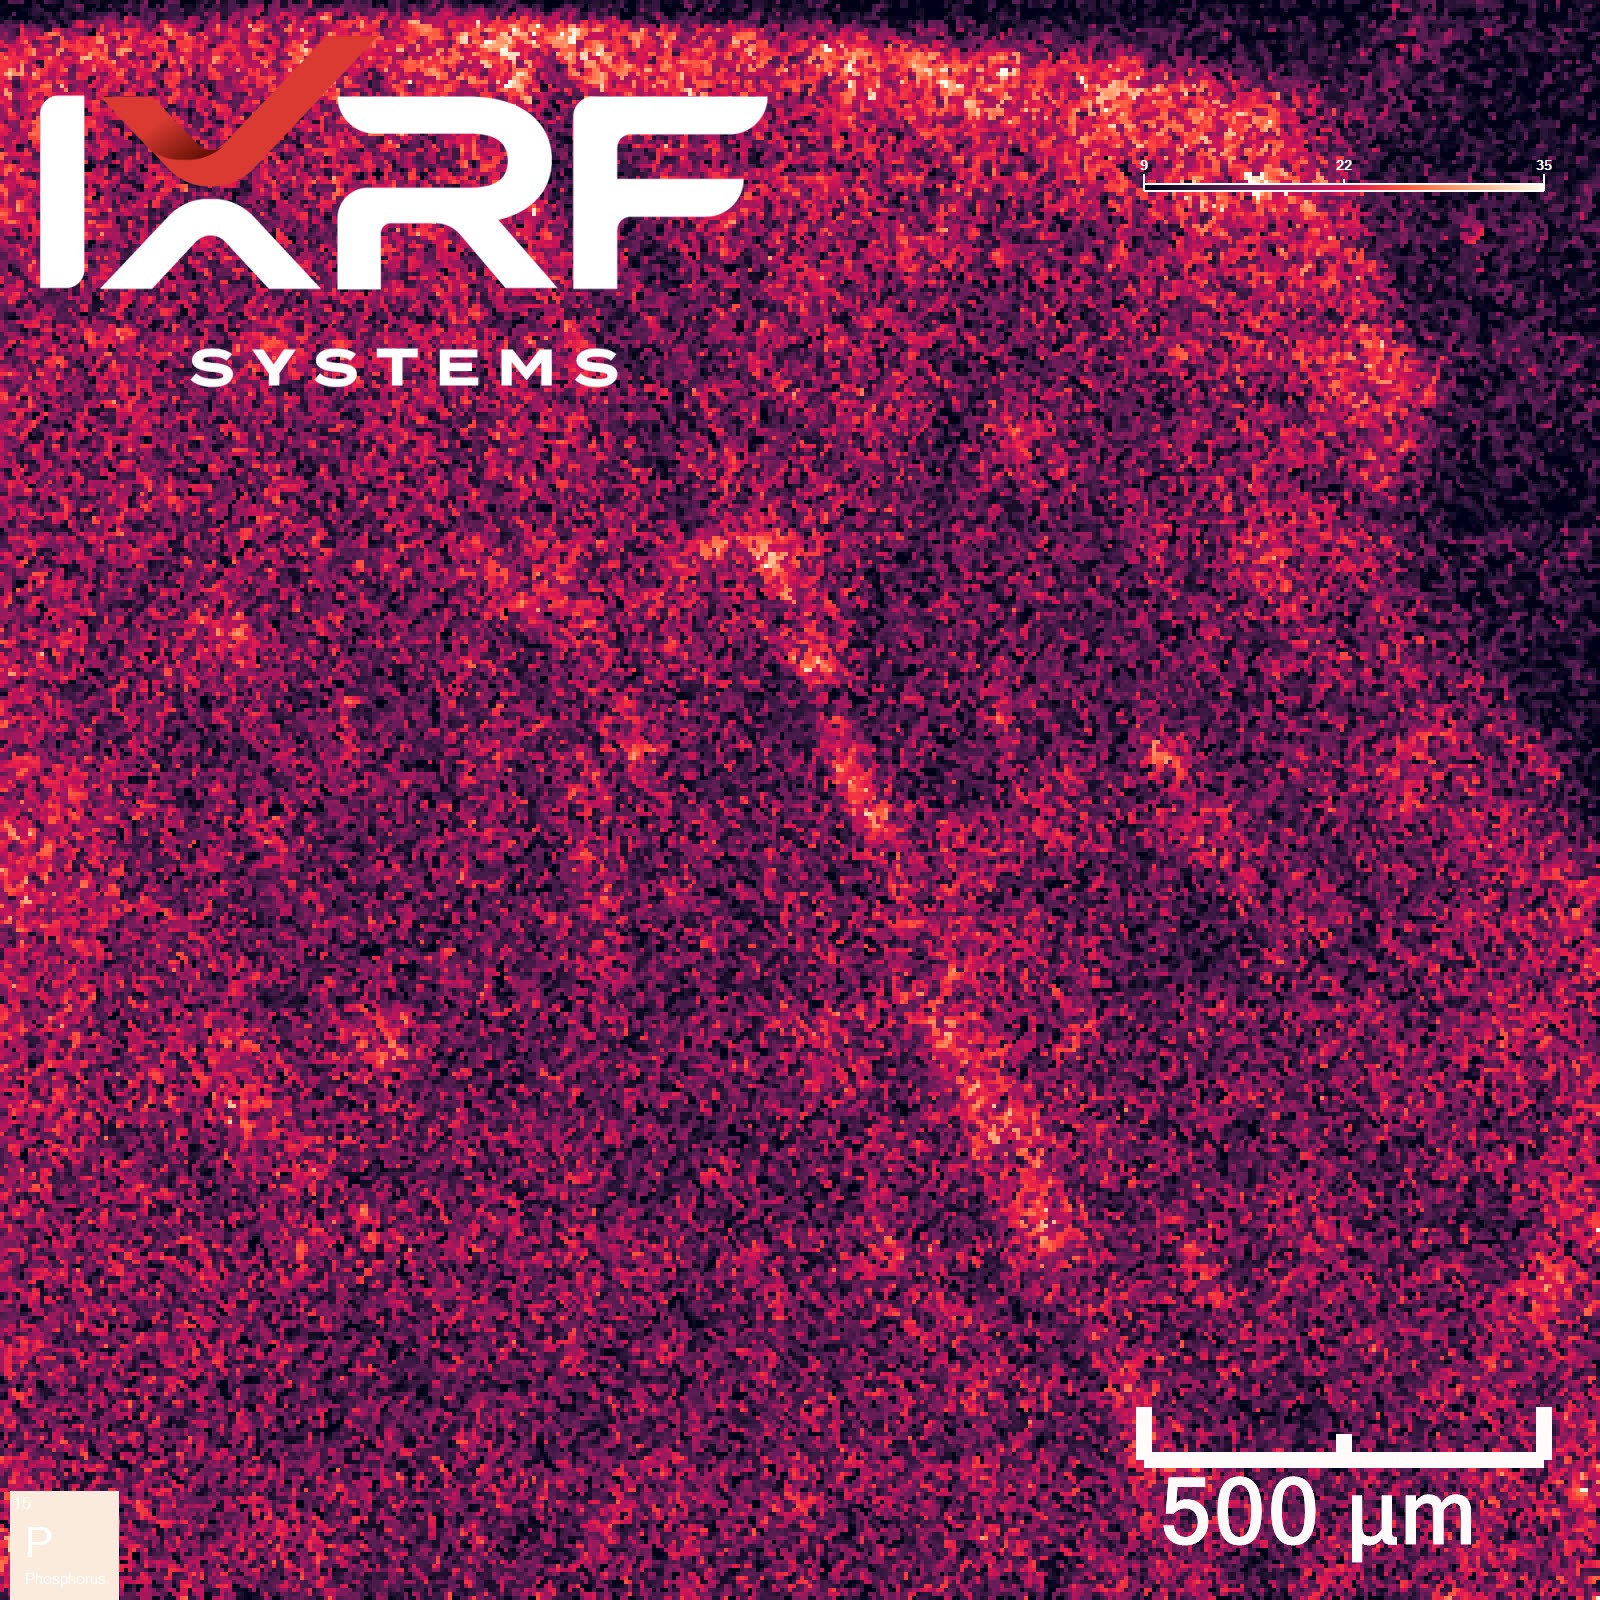
Figure 2. Micro-XRF elemental distribution maps of brain tissue revealing spatial localization of copper (Cu) and phosphorus (P).
Top and bottom panels show corresponding Cu (left) and P (right) maps of separate brain regions captured at 500 µm scale. The spatial correlation between phosphorus-rich cell bodies and copper-enriched structures may reflect neurophysiological compartmentalization or disease-related accumulation patterns. High-resolution mapping with IXRF’s microXRF system enables the identification of micron-scale elemental variations critical for neurochemical analysis.
For researchers: numbers, scales, and workflows that fit your study
- Spatial scales that inform
Pixel sizes from 5–25 µm; fields of view from millimeters to centimeters via tiling. That means single-nucleus detail when you need it, and full-region mosaics when you don’t want to miss the big picture. - Quantitation you can trust
Use NIST/AXO thin films or in-house matrix-matched standards for calibration; apply micro-XRF quant with FP (fundamental parameters) plus ROI-based QC checks. Export per-pixel concentrations (µg/g or wt%) and elemental ratios for statistics. - Correlation-ready
Because the tissue stays intact, you can line up micro-XRF with IHC, LA-ICP-MS, Raman, MRI, or synchrotron XANES to connect location, quantity, and speciation.
For the broader reader: why this is exciting
Think of the brain as a city at night. Some neighborhoods glow brighter because more lights (metals) are on. Micro-XRF is the aerial camera that shows which districts are bright in which colors (elements)—and how that changes when disease moves in. By seeing those patterns early, scientists can:
- Spot trouble sooner (potential for earlier diagnosis),
- Design smarter trials (target the right region with the right drug),
- Measure real change (did the therapy reduce the iron rim or just move it?).
Make every hour of beam time count
Applying for a beamline? Pre-characterize with the Atlas Apex first. You’ll arrive with:
- Tiled maps that flag the highest-value ROIs,
- Baseline ppm-level quantitation to set energy and dwell times,
- Hypotheses grounded in real spatial chemistry.
The payoff: fewer exploratory scans, more decisive speciation or nano-probe datasets, and stronger figures for your grant or paper.
Ready to see what your tissue has been hiding?
With IXRF’s Atlas Apex micro-XRF instruments, you can move from “we think metals matter here” to “here’s the quantitative map” in a single workflow—in your own lab, on your schedule.
Let’s map the hidden chemistry of the brain—together.
Click here to speak with an Application Expert for a demo or technical consult
The Future of Gemology Is Elemental
As gemstone markets become increasingly complex and competitive, the need for advanced, reliable analytical tools grows ever more critical. μ-XRF and m-XRF technologies have proven transformative in meeting these challenges, offering unmatched precision, efficiency, and reliability. IXRF Systems continues to pioneer these technologies, constantly innovating to enhance gemstone authentication and quality assessment. Gemologists and laboratory professionals are encouraged to explore how these cutting-edge tools can enhance their analytical capabilities, improve operational performance, and foster stronger trust among their clients. For more detailed insights and tailored advice on integrating microXRF and macroXRF into your workflow, we invite you to reach out and connect with our expert team today.
References (selected)
- Collingwood, J. F., & Adams, F. (2017). Chemical imaging analysis of the brain with X-ray methods. Spectrochimica Acta Part B, 130, 101–118. https://doi.org/10.1016/j.sab.2017.02.013
- Zhang, R., Li, L., Sultanbawa, Y., & Xu, Z. P. (2018). X-ray fluorescence imaging of metals and metalloids in biological systems. J. Nucl. Med. Mol. Imaging, 8(3), 169–188.
- Grochowski, C., et al. (2019). Analysis of trace elements in human brain: Its aim, methods, and concentration levels. Frontiers in Chemistry, 7, 115. https://doi.org/10.3389/fchem.2019.00115
