For our SEM-EDS, SEM-XRF and microEDXRF products, IXRF offers Iridium Ultra: an all-inclusive state-of-the-art software suite featuring a myriad of comprehensive qualitative and quantitative capabilities supporting both e-beam and X-ray excitation. Included are stage control and automation, data acquisition, spectral manipulation (including deconvolution and artifact removal), mapping, imaging, and statistical analysis tools. The platform is unsurpassed in it’s ability to provide elemental and phase mapping, line scans, critical dimensions (CD) as well as qualitative and quantitative elemental analyses. For the ATLAS microXRF line, this includes analysis of solids, liquids, particles, powders and thin films.
Advanced EDS/XRF Elemental Analysis & Imaging Software
IRIDIUM ULTRA
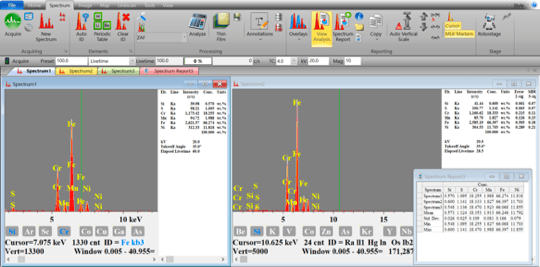
Spectra Overview
- Identifying Elements
- Spectrum Processing
- Annotations
- Spectrum Overlay
- Spectrum Reporting
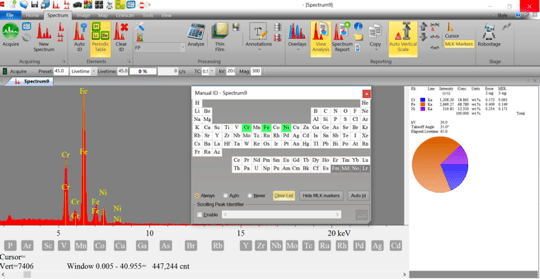
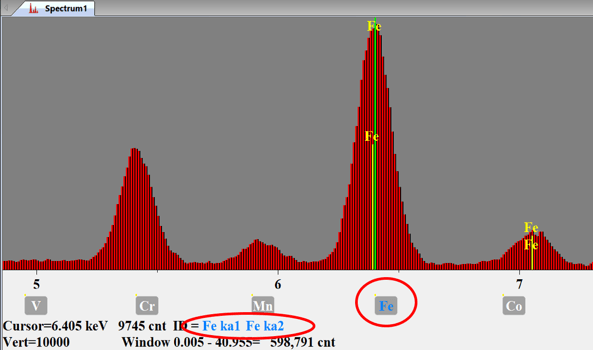
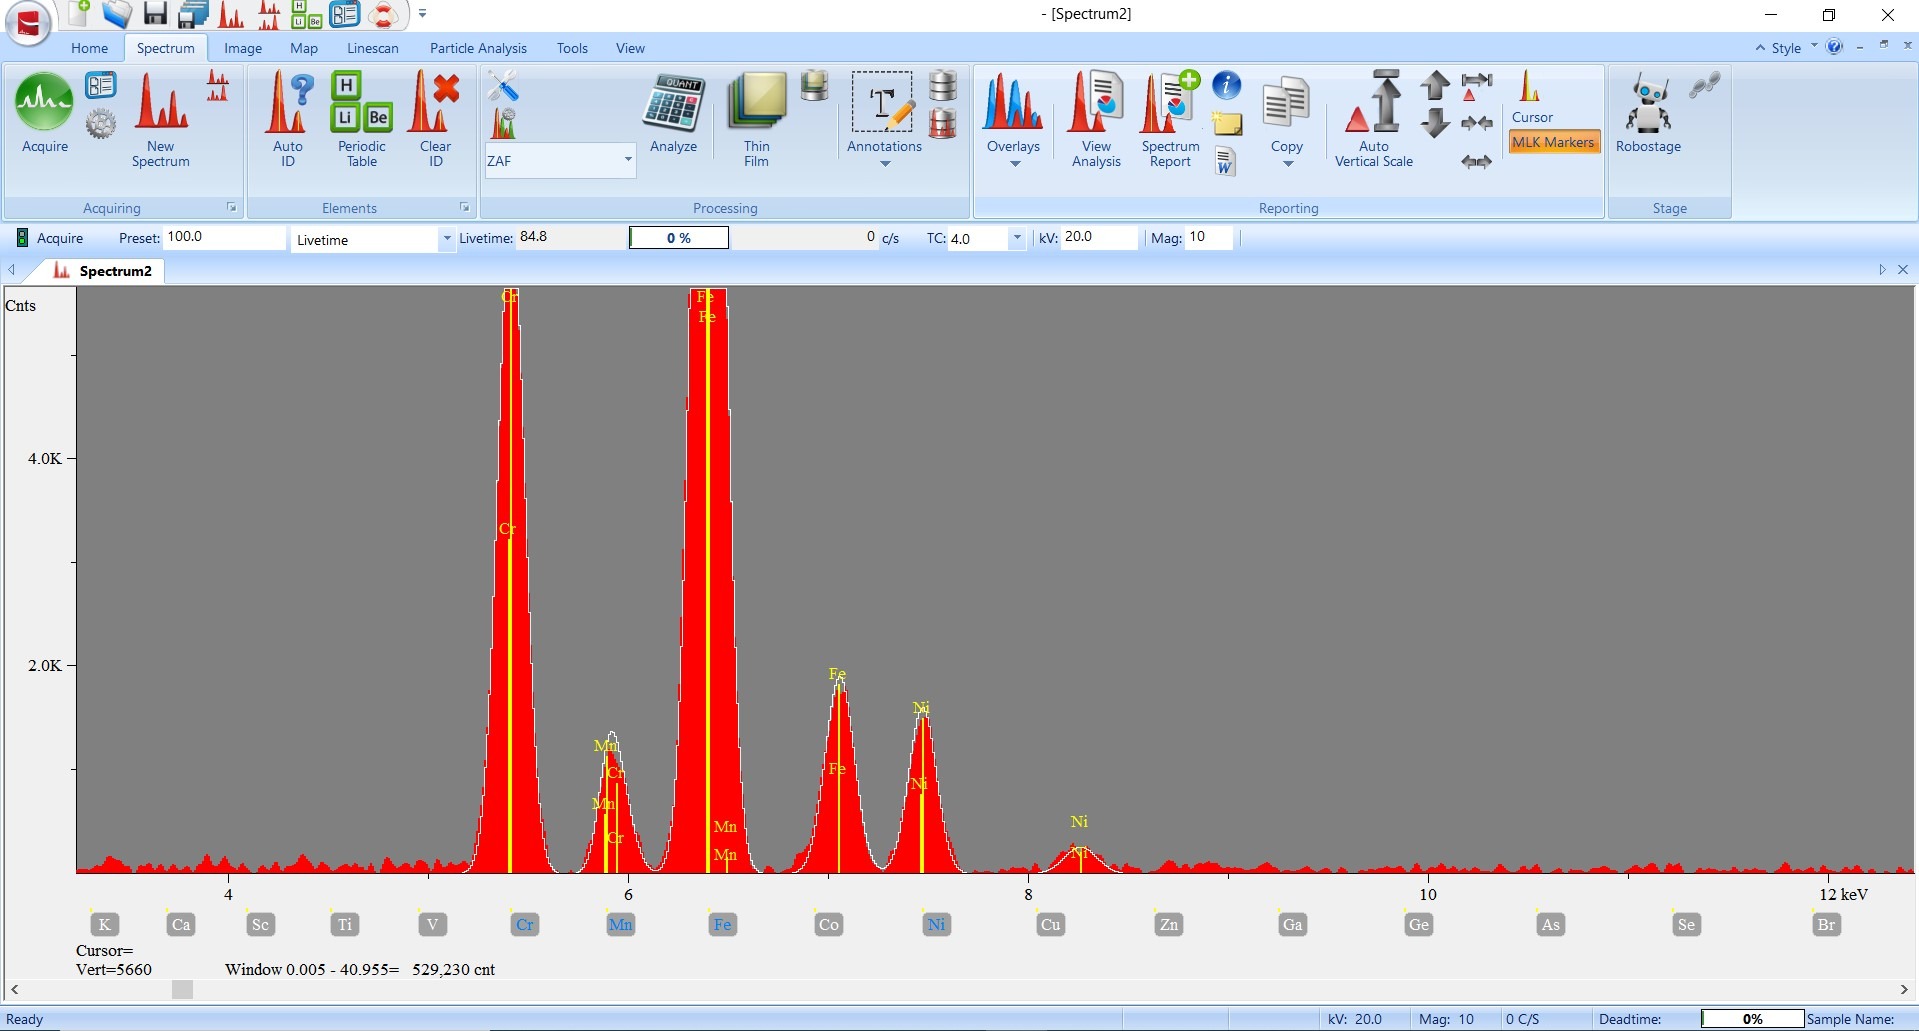
Identify Elements
Kα Energy Markers help easily identify elemental peaks
Identify elements through cursor ID by selecting individual energy channels.
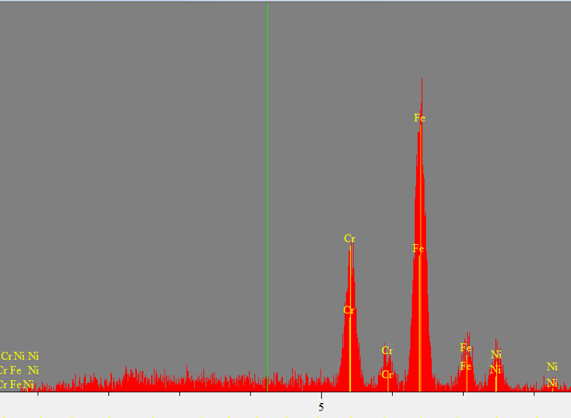
Spectrum Processing
• Peak separation using Gaussian deconvolution
• Automatic peak-overlap correction
• Automatic escape and sum peak removal
• Automatic Standardless Quantification using ZAF
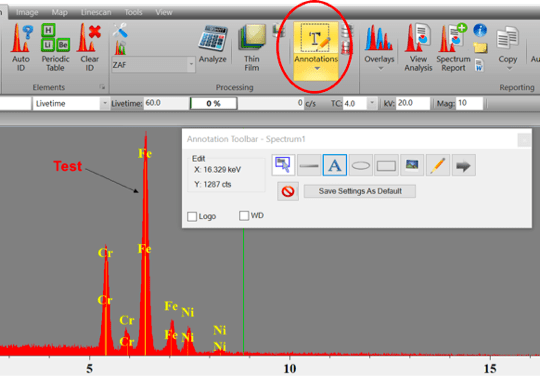
Annotation
Selecting Annotations from the Spectrum toolbar opens a new window that allows the user to measure, label, add text, etc. on the spectrum. These annotations are fully customizable and can be exported with the spectrum.
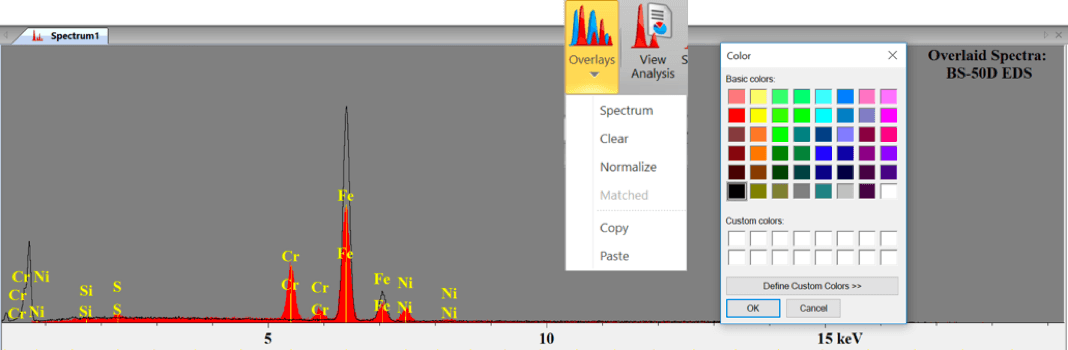
Spectrum Overlay
Spectra can be overlaid to easily compare the relative compositions in samples
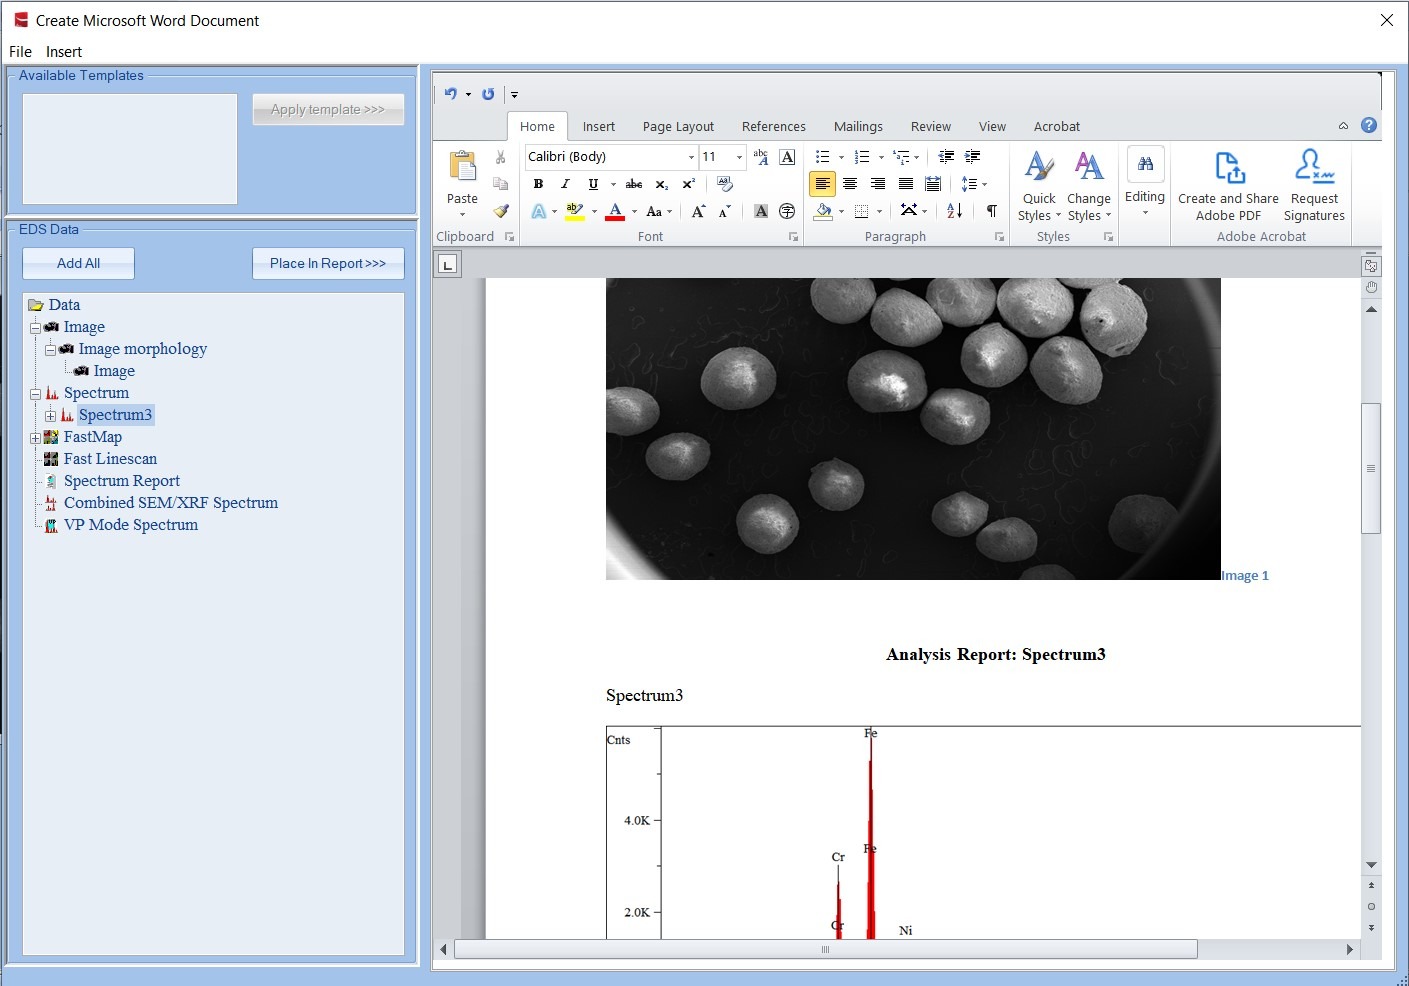
Spectrum Reporting
Create a simple spreadsheet report of multiple spectra’s quantitative analysis.
IMAGING OVERVIEW
- Image Acquisition
- Analysis Suite (Toolbar)
- Morphology
- Segmentation
- Stitching/Montage
- Automated Particle & Multi-point Analysi
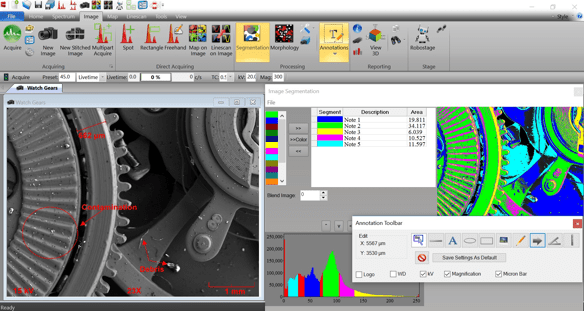
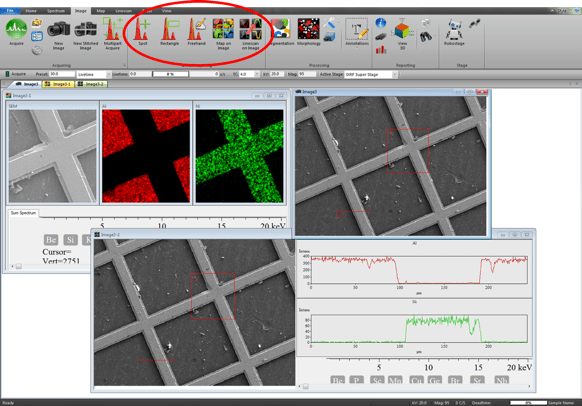
IMAGE DIRECT ACQUIRE
The Direct Acquire tools allow for EDS data to be collected by selecting the region of interest from the SEM image. This includes spot/rectangle/free hand spectra as well as maps and linescans on the image.
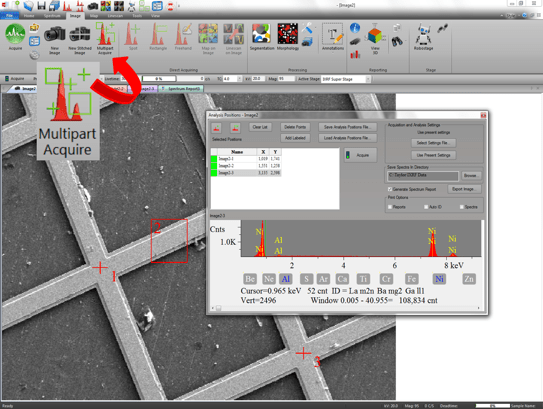
MULTIPART ACQUIRE
Multipart Acquire allows fully automated spectrum analysis with customized EDS settings and automatically generated spectrum analysis reports. This includes single point, raster area, and freehand line spectrum acquisition.
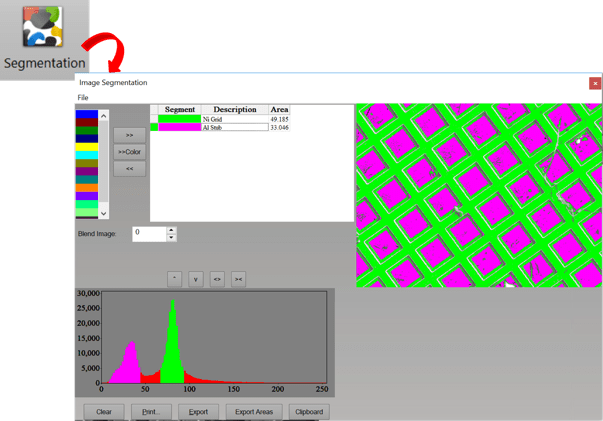
SEGMENTATION
Image Segmentation provides a visual representation of different phases in an image. Based upon histogram analysis, you can see the percent area each phase occupies.
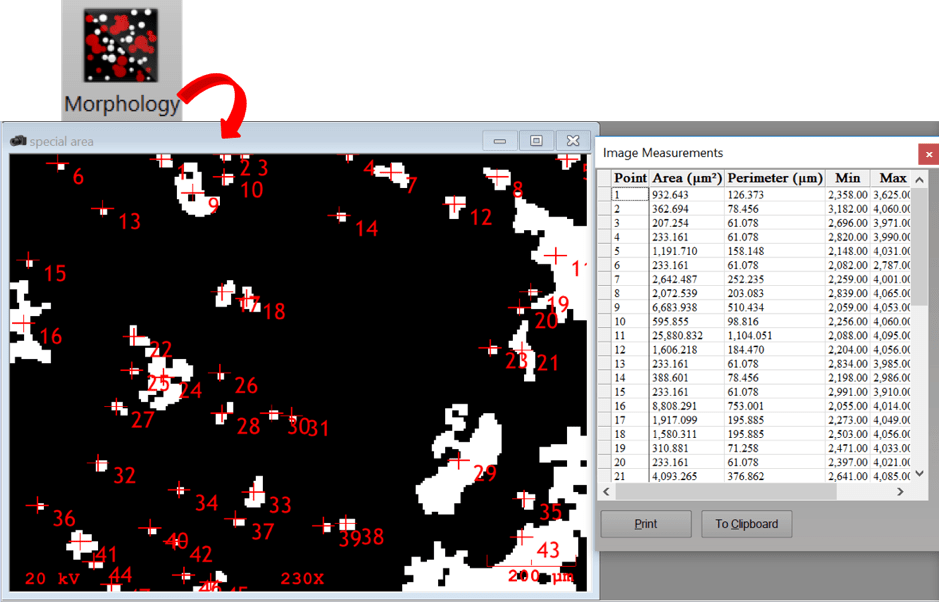
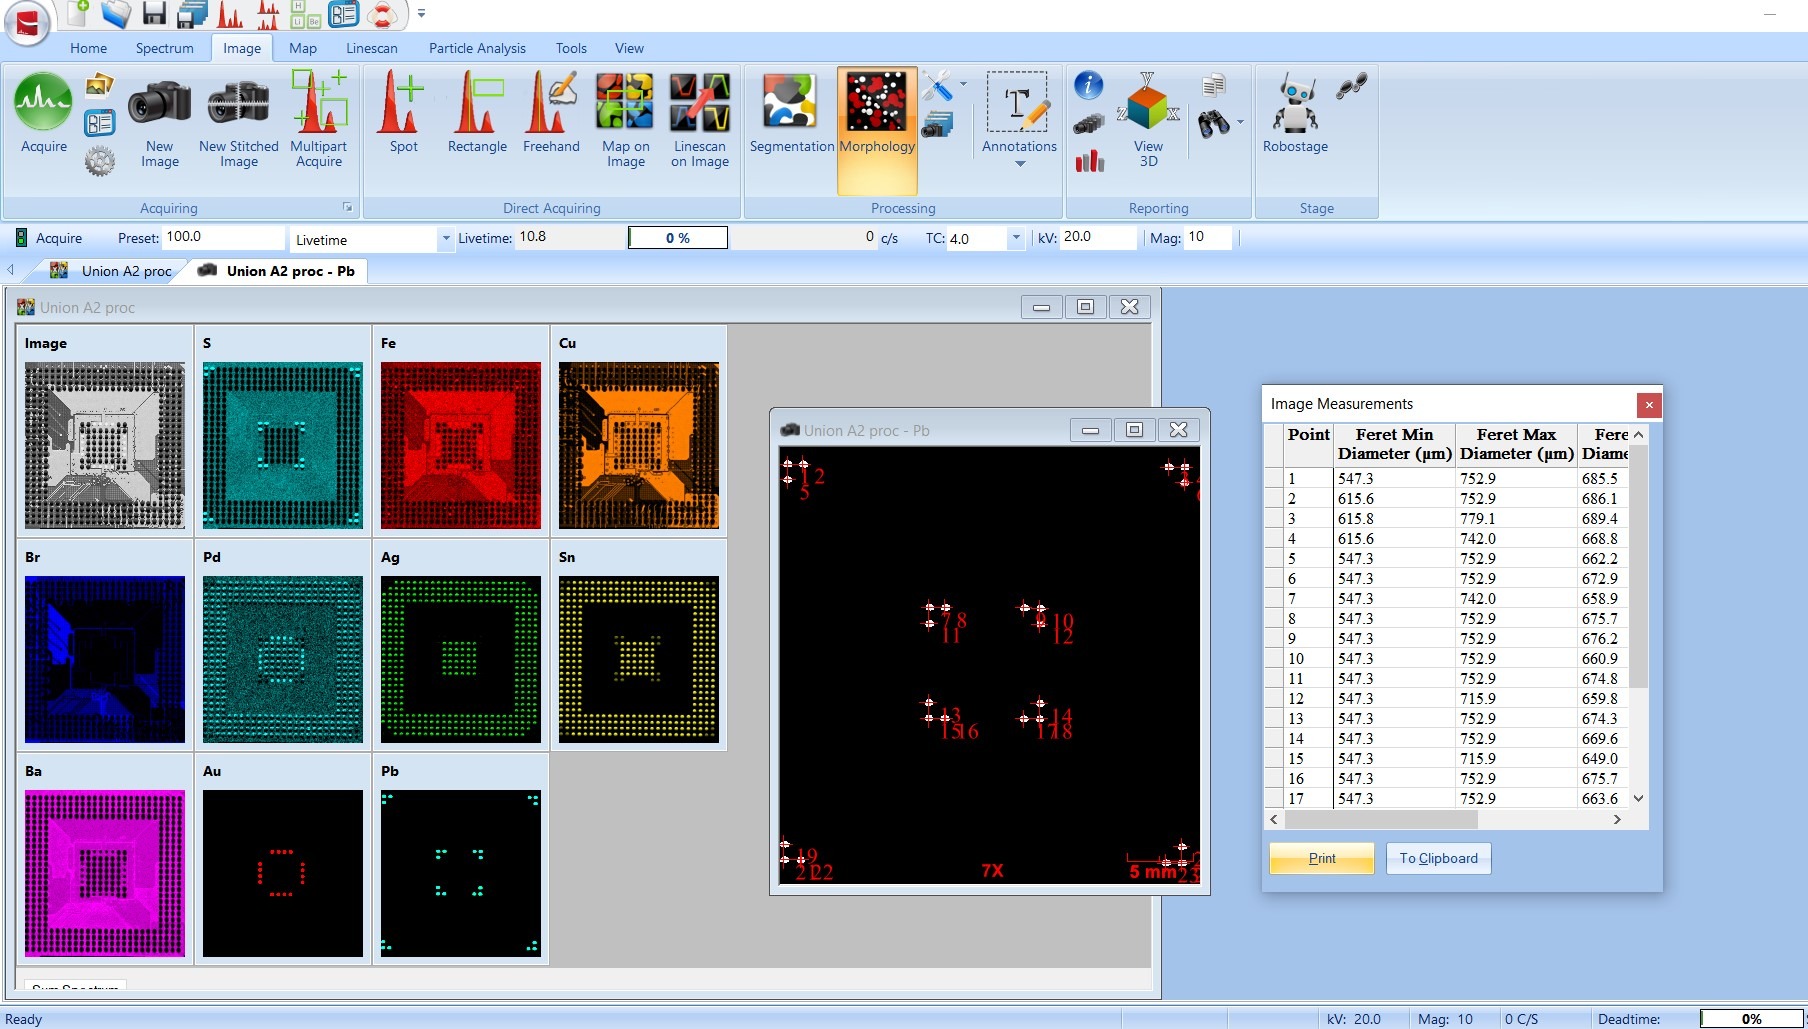
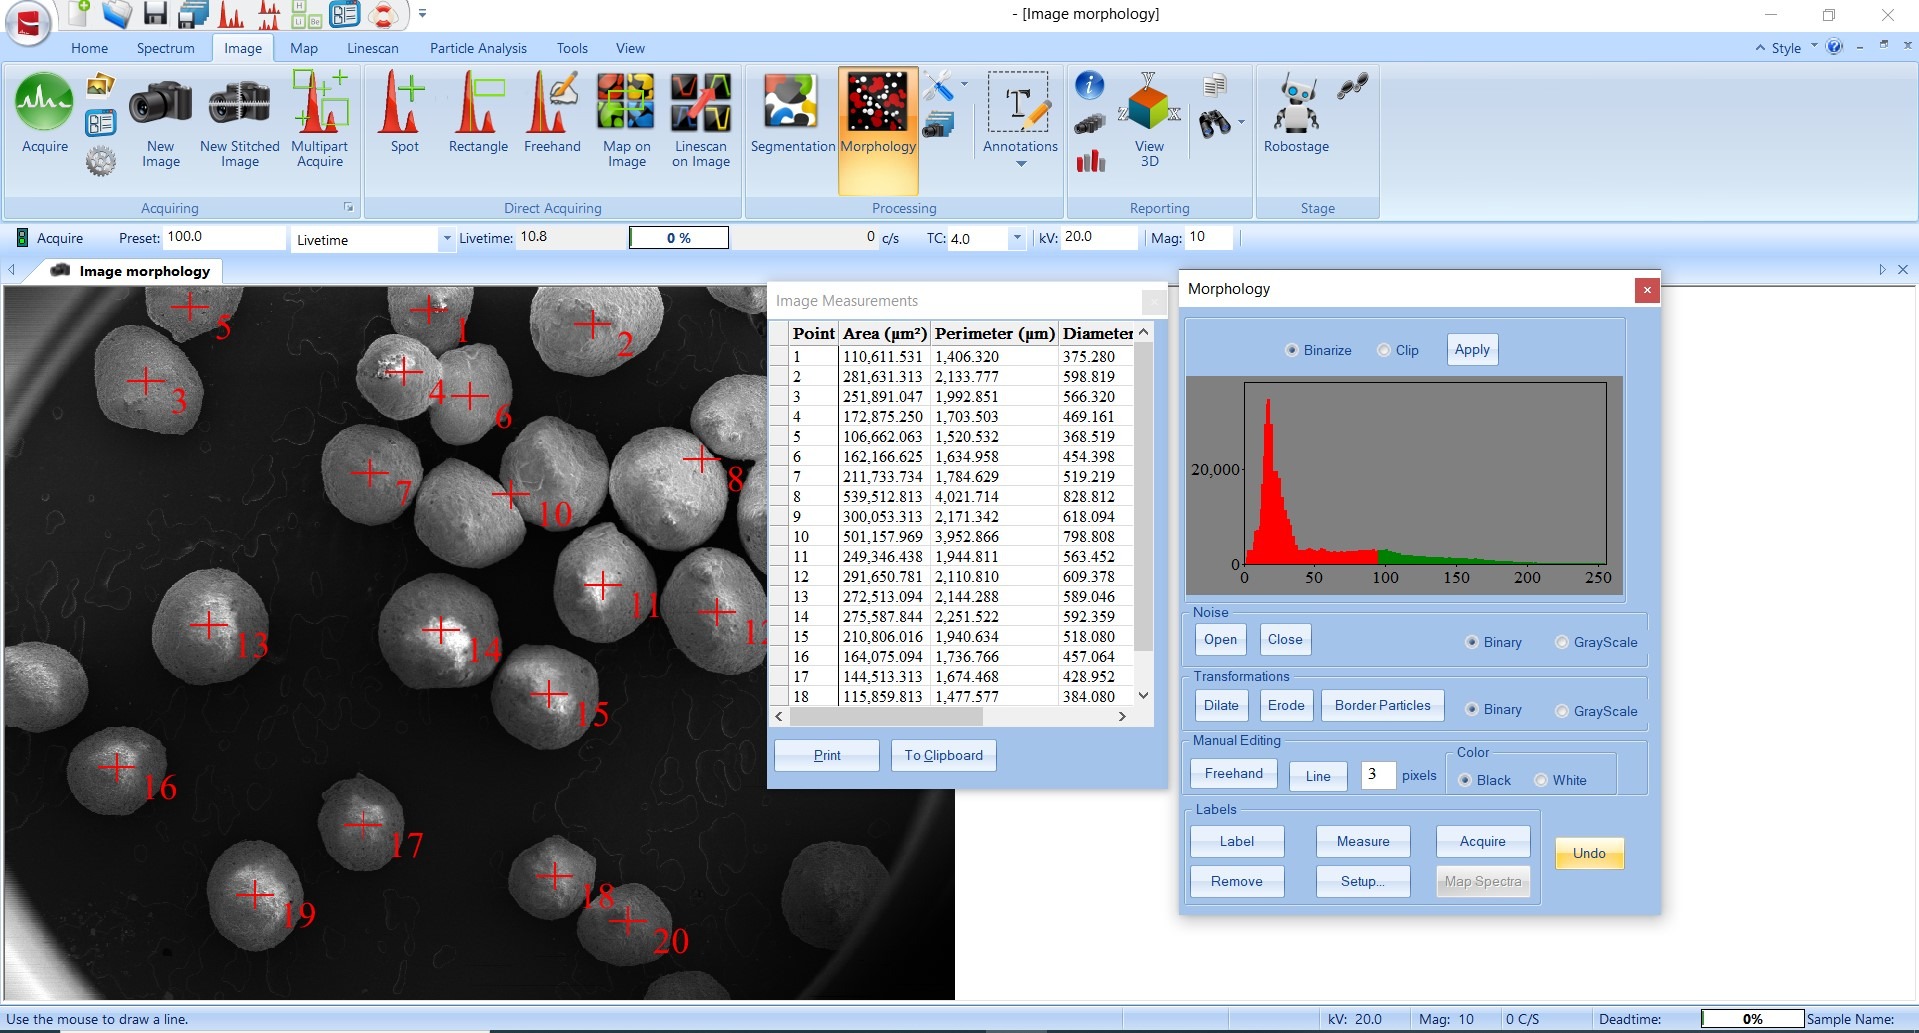
MORPHOLOGY
Image Morphology provides particle information through image binarization. Image binarization transforms the image into grayscale based upon histogram data.
This allows you to label and measure pixels to provide an abundance of morphological data.
LINESCANS OVERVIEW
- Multielement Linescan Acquisition
- Linescan Overlay
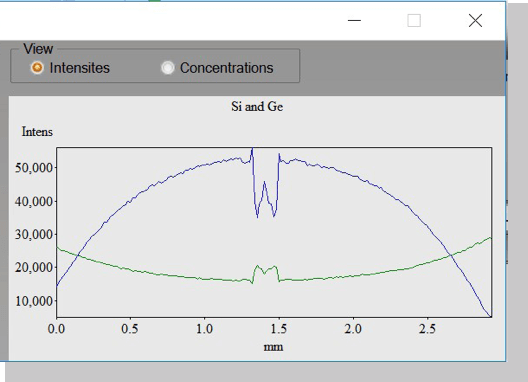
- DataView (Intensity/Concentration)
- MultiScan
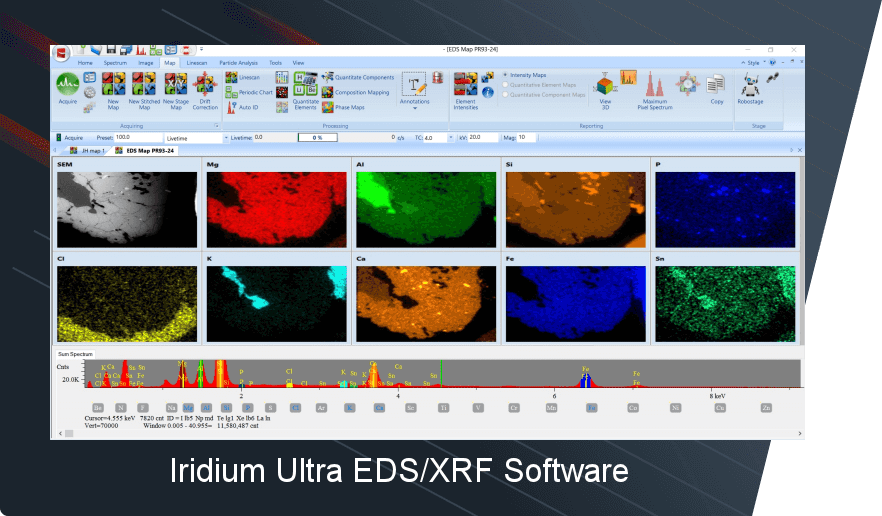
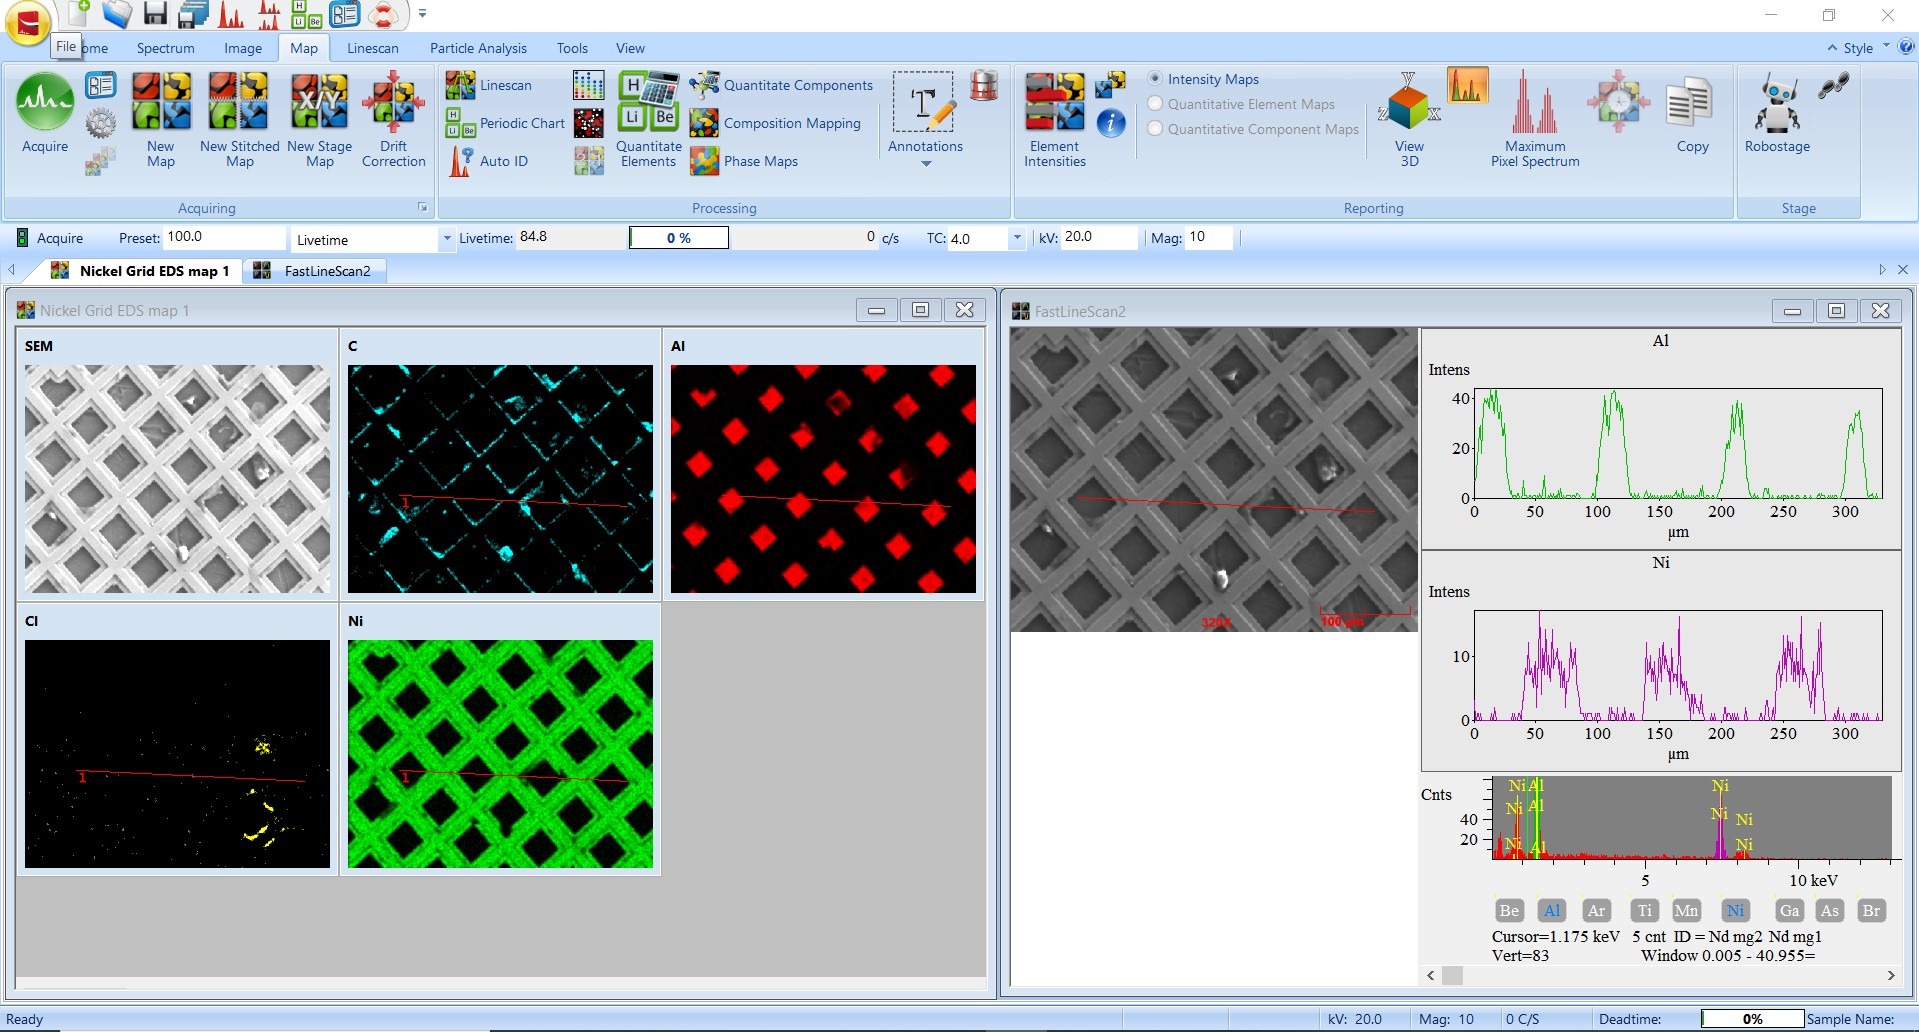
MAPPING OVERVIEW
- Mutielement Quantitative Mapping
- Overlay Maps
- Map Analysis Suite (Toolbar)
- Extract Spectra (Freehand, Spot, Area)
- Extract Linescan
- DataView (Intensity/Concentration)
- Beam Drift Correction
- Maximum Pixel Spectrum
- Map stitch & montage
- Automate Stage and Beam automation
- Composition Mapping
- Phase Analysis
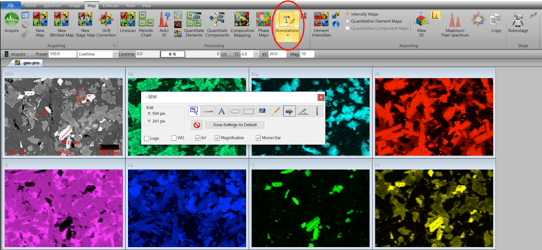
MAPPING ANNOTATIONS
Selecting Annotations from the Map toolbar opens a new window that allows the user to measure, label, add text, etc. on the map.
SPECTRA FROM MAP
Combine X-Ray Map pixels to extract spectra from a region of interest
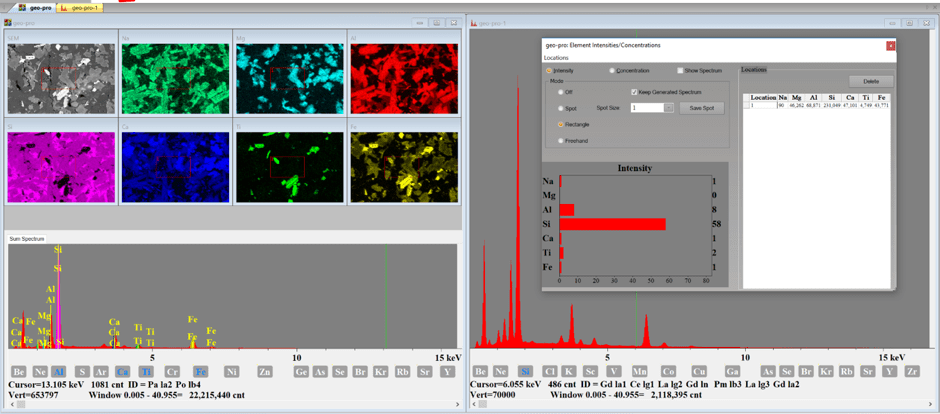
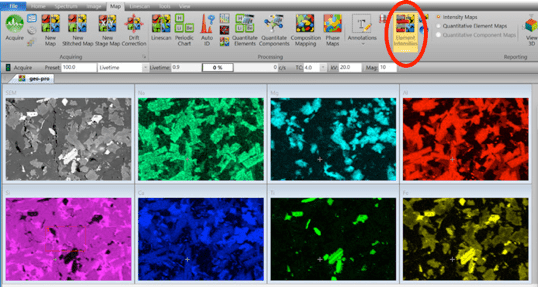
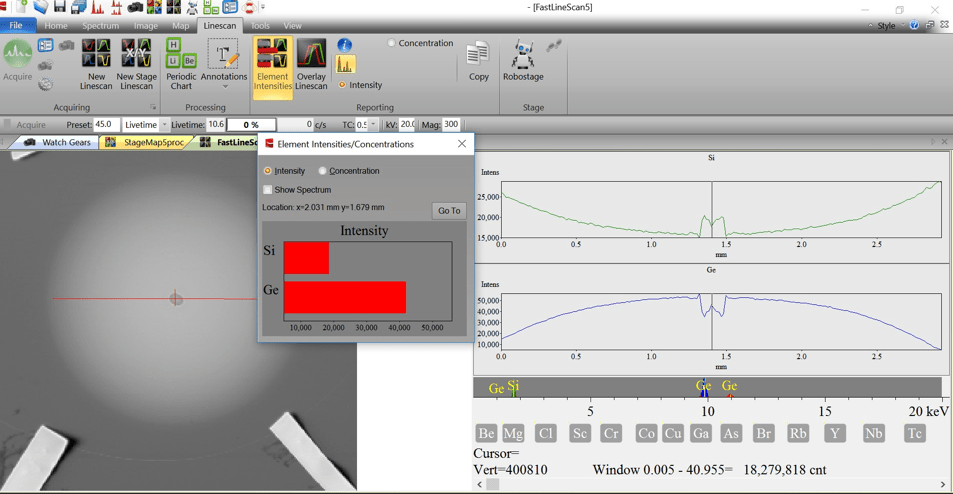
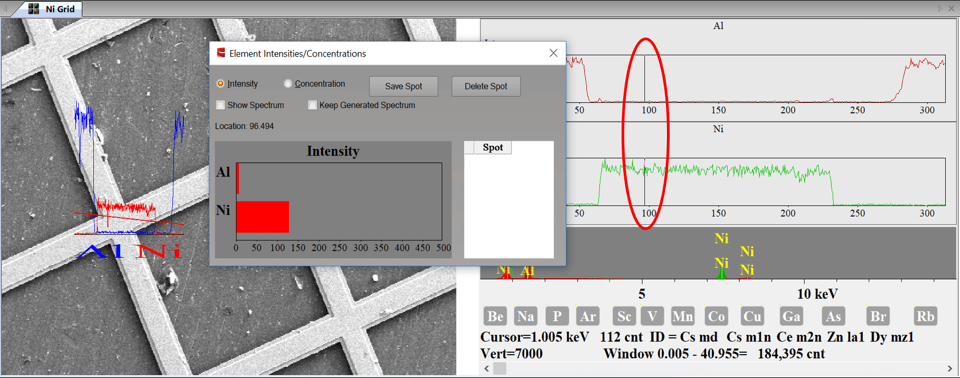
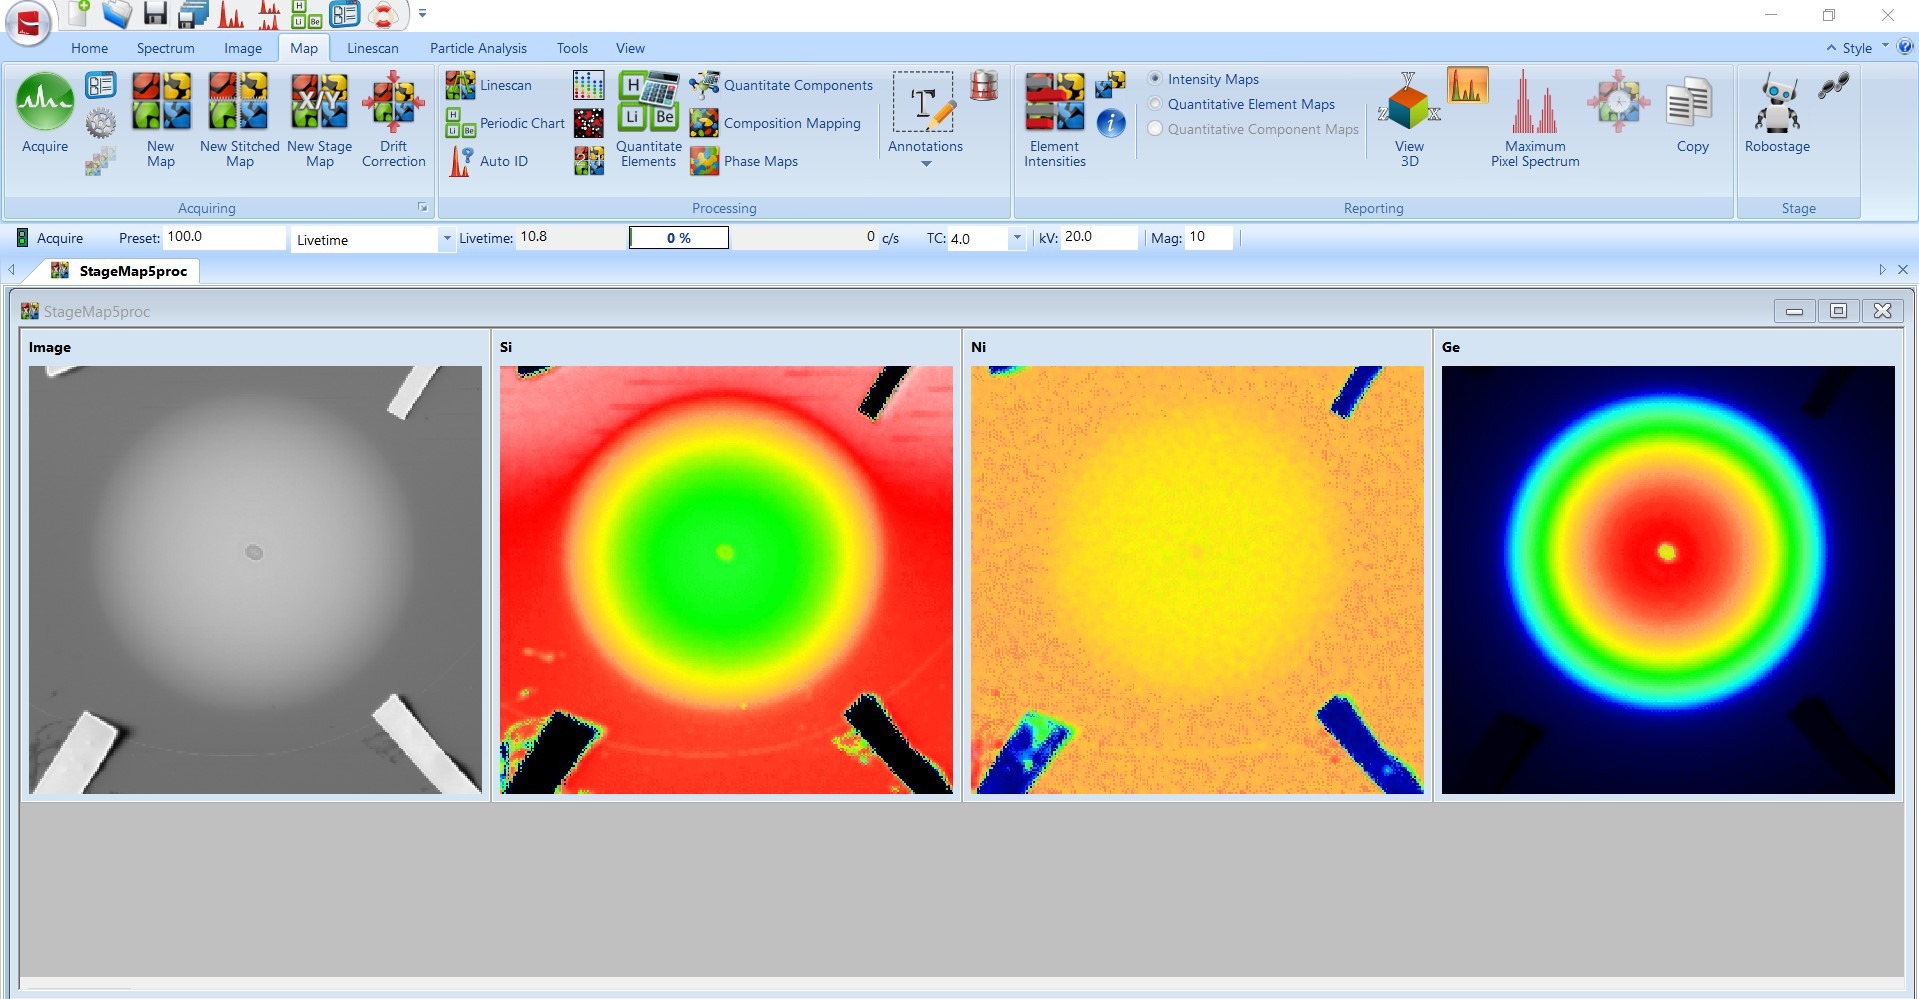
ELEMENTAL INTENSITIES
Selecting Element Intensities from the Map tab will open a new window. A spot/rectangle/freehand can be placed on the image to compare the intensity/concentration.
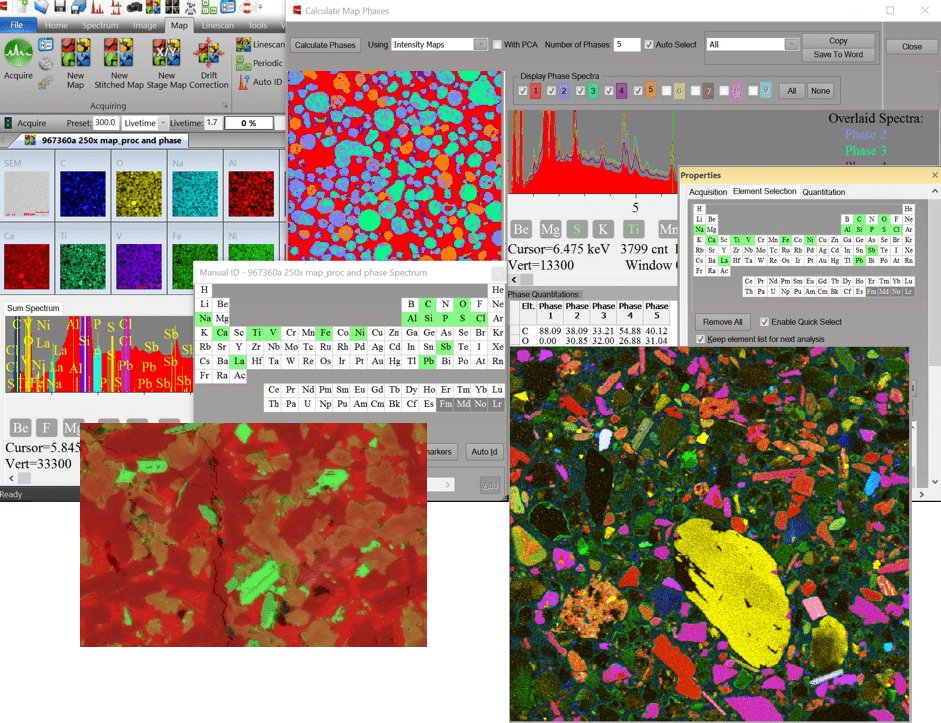
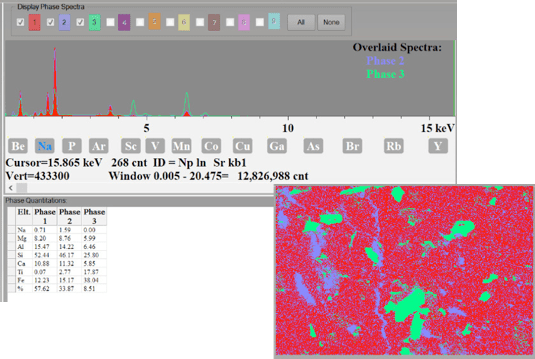
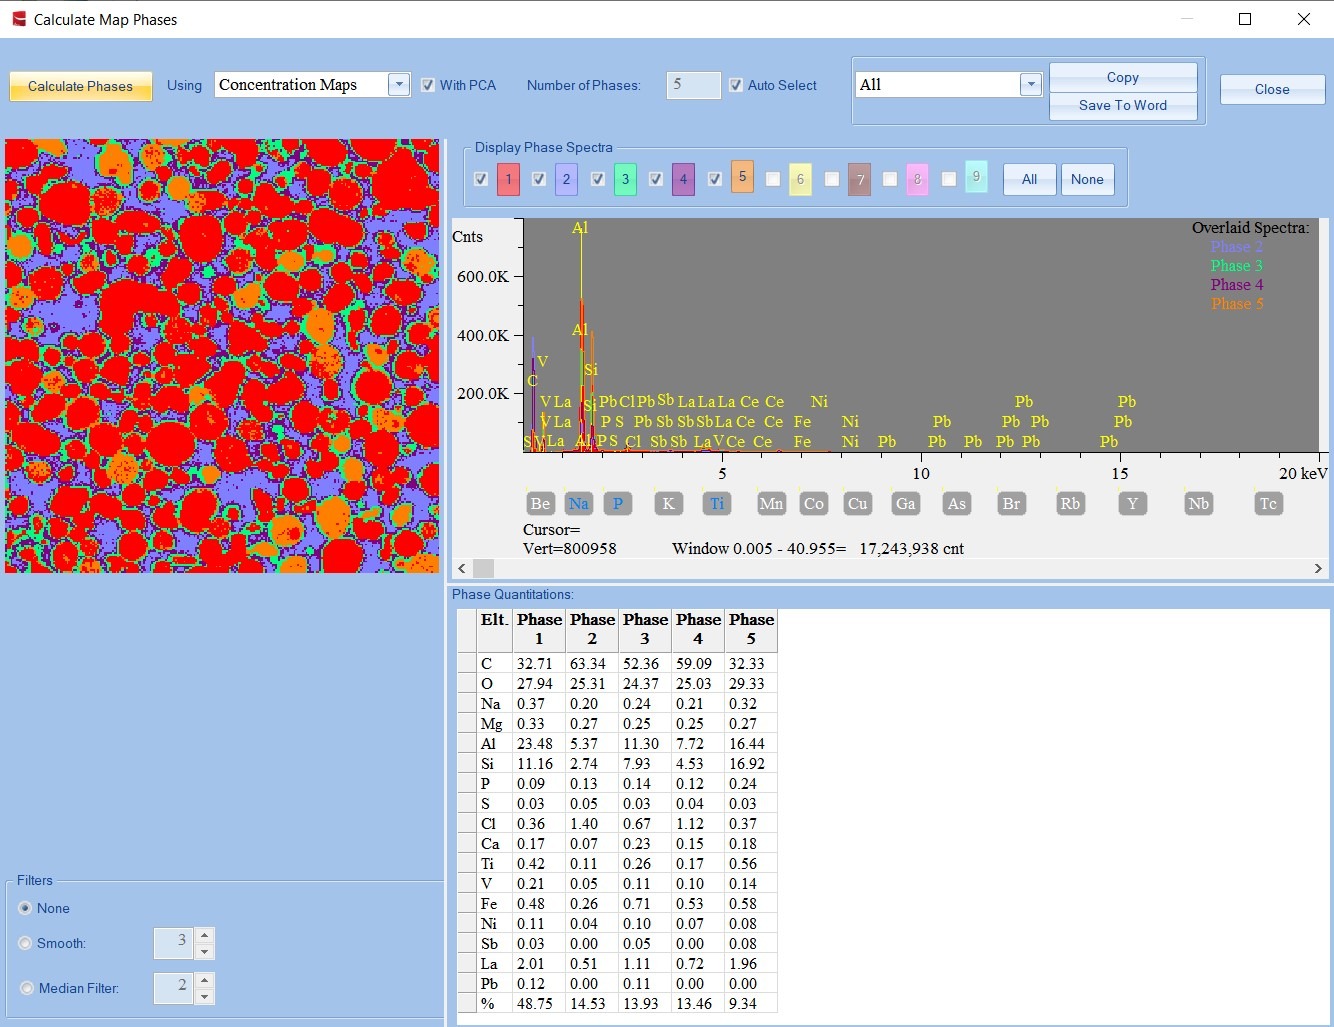
PHASE MAPS
Selecting Phase Maps from the Map tab will identify different phases within a sample and quantitatively analyze the elements within each phase.
The different phases will be graphically displayed in a map alongside phase-specific overlaid spectra to provide a qualitative comparison.
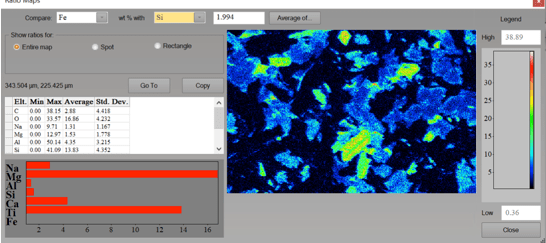
RATIO MAPS
Analyze the element ratios in a region of interest and displays a comparison of element weight percent ratios.
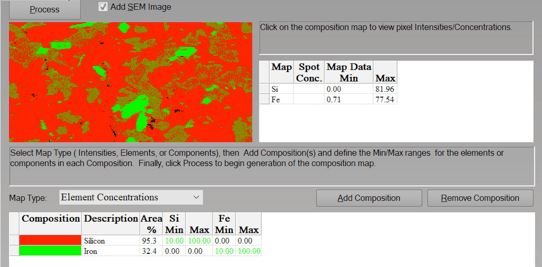
COMPOSITION MAPPING
Selecting Composition Mapping from the Map tab will identify map locations containing specific element concentrations according to specified parameters.
Quantitative analysis is performed on every pixel where a calculated concentration is compared to a specified concentration. Matching pixels are then displayed in the composition map.
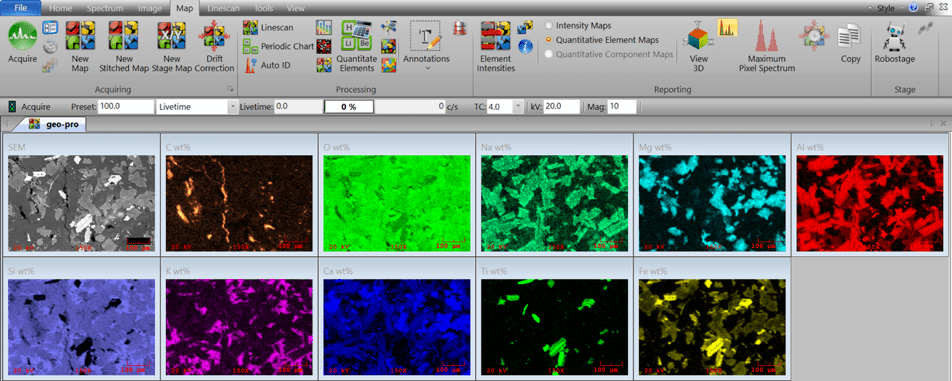
QUANTITATIVE ELEMENT/COMPONENT MAPS
Quantitative Maps convert the displayed pixel data to Concentration (wt%) from Intensity (cps).
This feature can display the quantitative maps as either elemental maps or components maps (ie; oxides).
Thermal / Heat Maps
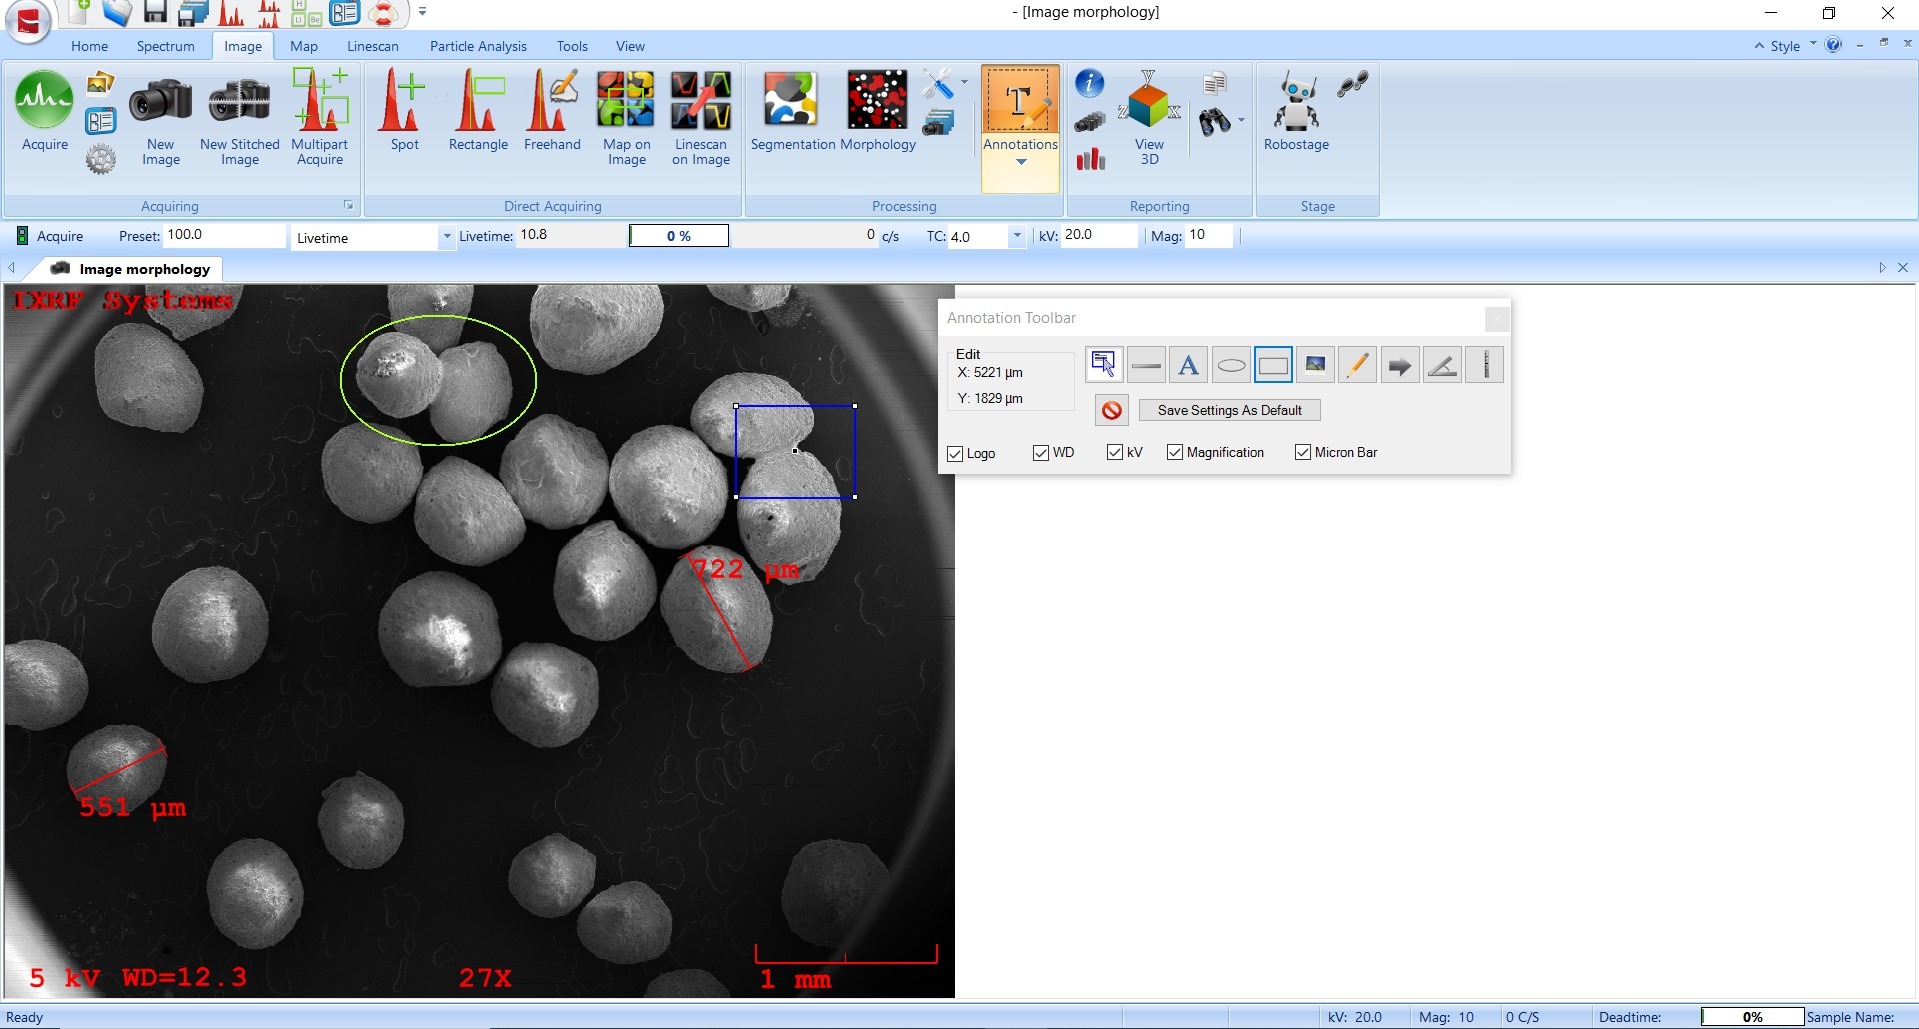
Image Analysis
Peak fitting & Deconvolution
Line Scan From a Map
Morphology From a Map
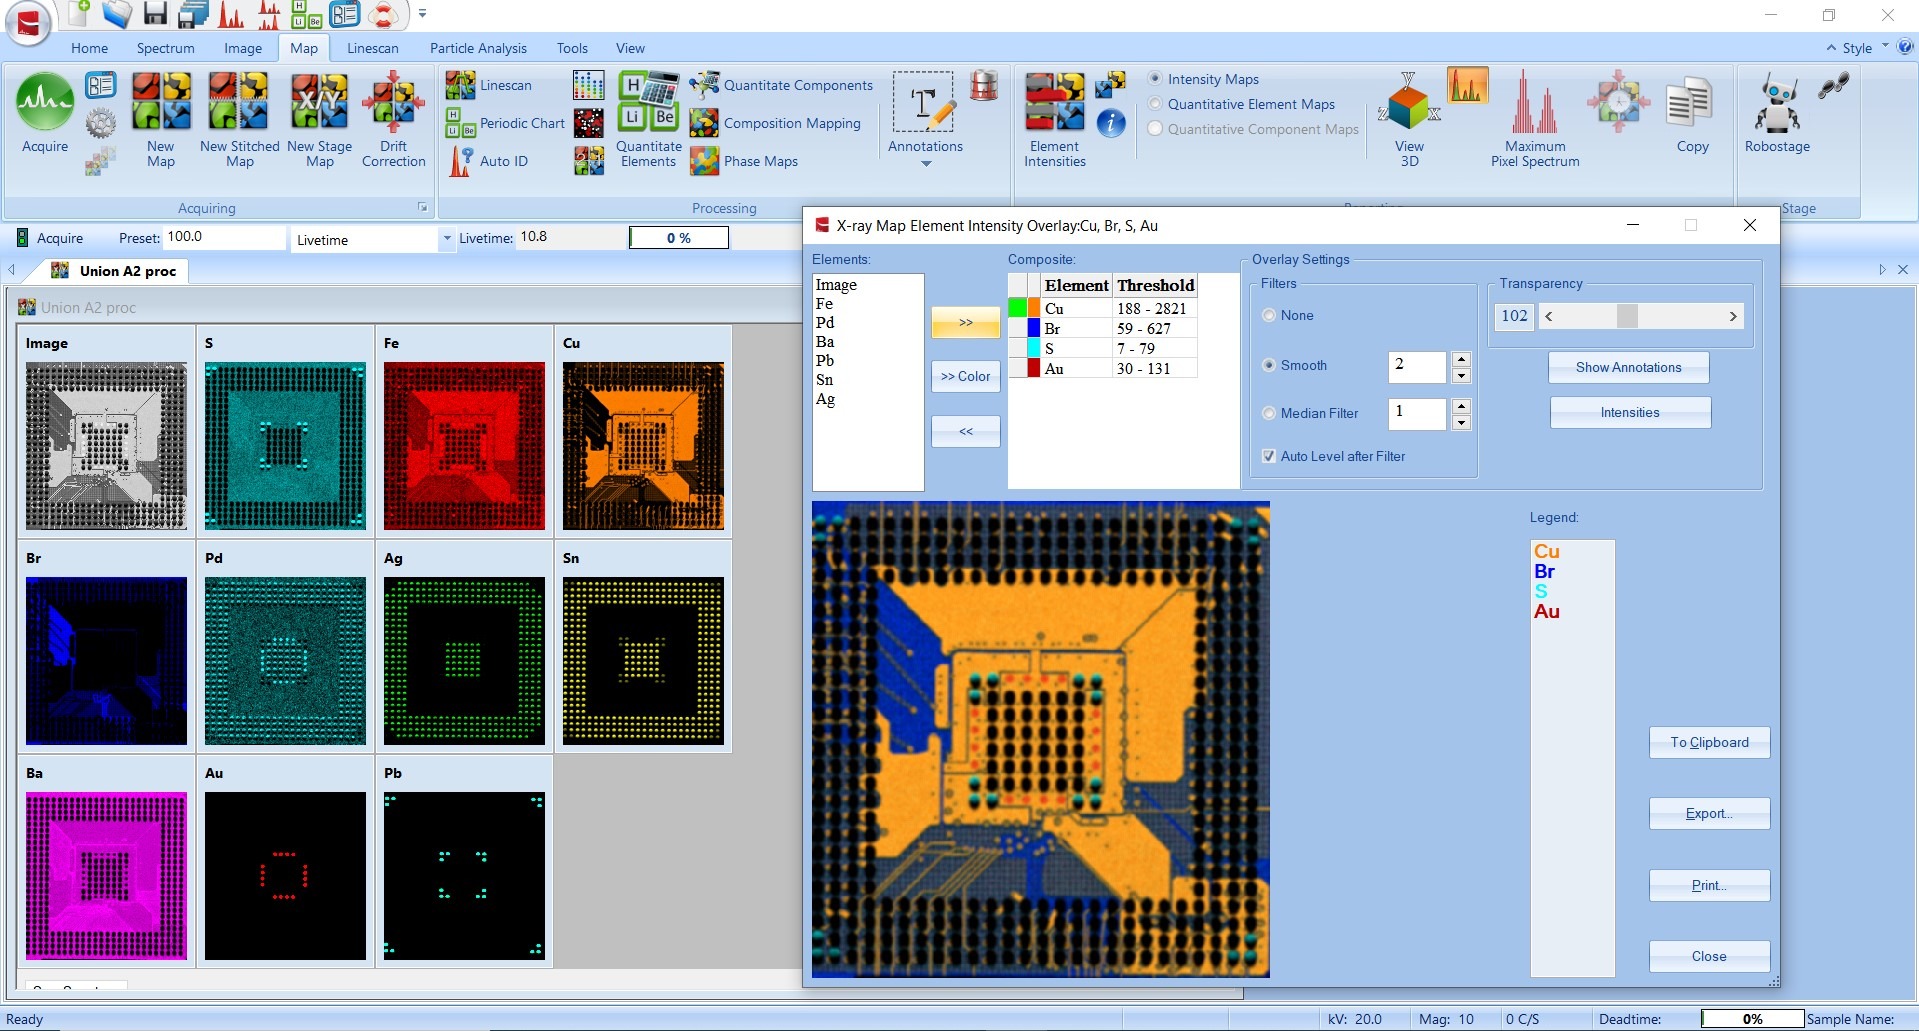
Elemental Map Overlays
Morphology
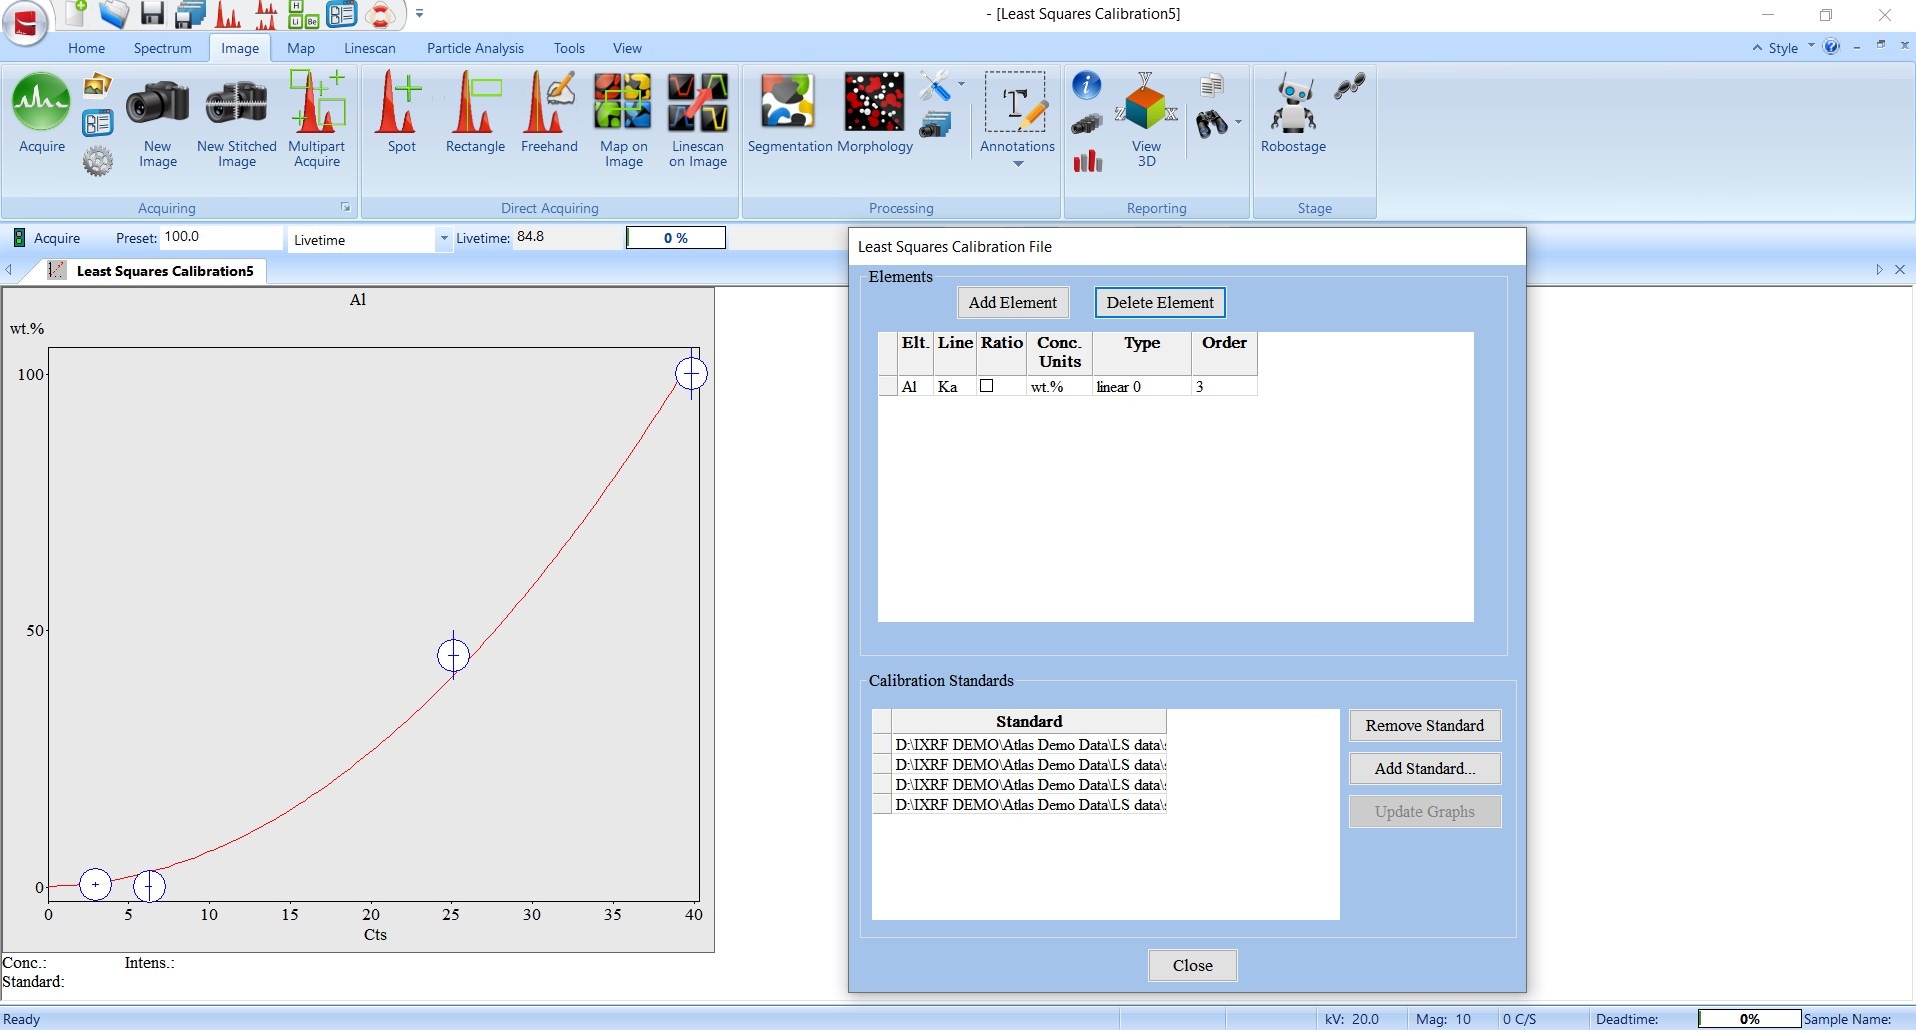
Least Squares Calibration
Automatic Phase ID on Maps