Written by Ben Ruchte, P.E., Director of Product Engagement
Introduction
In our previous article, “Is Micro-XRF Technology the Missing Link in Standard Metallurgical and Failure Analysis of Ferrous-Based Components?” we explored the transformative potential of microXRF technology in enhancing the analysis of ferrous materials. This advanced analytical tool offers a comprehensive view of elemental distribution, non-destructive advantages, and the ability to scan large areas backed by powerful X-ray sources. But how does this technology apply in practical scenarios, especially in industries where material integrity is paramount? To delve deeper into this question, we now focus on a real-world case study in the food and beverage industry, where corrosion in 316L stainless steel poses significant challenges and underscores the benefit of cutting-edge analysis techniques. In this article, we will explore how microXRF technology offers the potential for understanding and mitigating corrosion issues in stainless steel components deployed in food and beverage processing.
Background
316L stainless steel (316L SS) stands as a preferred material for structural components, celebrated for its exceptional blend of high toughness, formability, and resistance to creep. Simultaneously, it commands profound interest in many other applications due to its impressive capability to withstand uniform and localized corrosion, particularly pitting. This remarkable performance owes itself to its significant chromium and molybdenum content, carefully selected alloying elements, and a deliberate approach to stabilize the face-centered cubic (FCC) austenite phase. However, it is important to note that the material may occasionally host minor phases, a feature contingent upon processing conditions and the presence of impurities.
- Chromium – improves corrosion resistance through the generation of a protective Cr-oxide passivation layer
- Nickel – FCC stabilizer – increases strength and toughness
- Molybdenum – improves resistance to pitting and crevice corrosion in chloride and sulfur environments
- Manganese – FCC stabilizer – increases high-temperature strength
- Silicon – deoxidizing agent
- Phosphorus and Sulfur – increase machinability
- Carbon – ‘L’ for low carbon content helps prevent chromium carbide formation at the grain boundaries
In 316L SS, the primary defense against external corrosion is the Cr2O3 film, formed due to the alloy‘s high chromium content. This protective oxide film can be breached during pitting corrosion, exposing the metal to a corrosive environment. Any disturbances in the film‘s composition, thickness, or integrity can accelerate localized oxide degradation and serve as favorable sites for pit formation. Surface irregularities resulting from manufacturing processes, subsequent machining, or the presence of porosity can also impact pitting behavior. In conventionally processed 316L SS exposed to chloride solutions, corrosion pits evolve through three successive stages: nucleation, metastable growth, and stable growth (Figure 1). Nucleation typically occurs around micron-sized manganese-rich sulfide (MnS) inclusions, which are present due to the alloy‘s sulfur content and are often added to improve machinability. These regions adjacent to MnS inclusions exhibit high electrochemical activity. As chloride solution accesses the metal, electrochemical reactions commence, with iron oxidation and hydroxide formation. In this stage, the oxide film generally remains intact, except in the pit‘s vicinity. Subsequently, the influx of reaction residues and the release of products further damage the oxide film, forming cracks and enlarging the pit. This process continues under steady-state conditions due to transport limitations within the narrow pit. Eventually, a new oxide film forms as the pit widens, and the corrosion activity subsides.
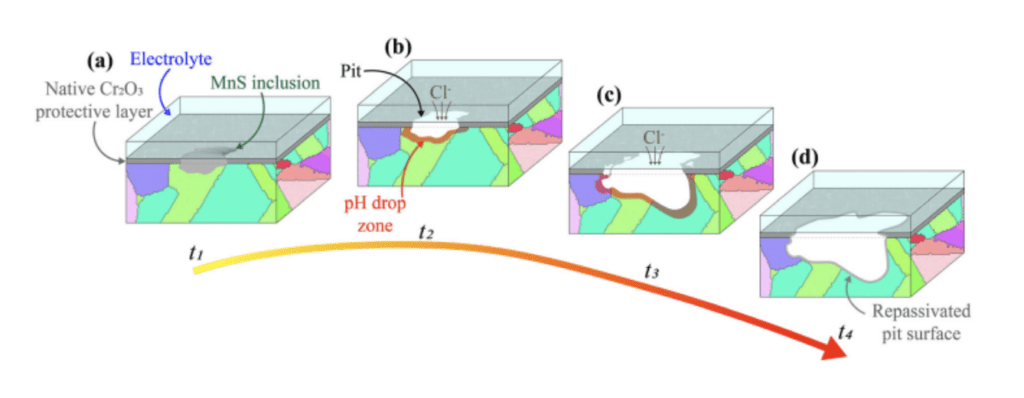
Figure 1. Schematic of pit formation and evolution in 316L SS exposed to a chloride solution.
Case Study
The following case study will provide a high-level summary of the findings from a particular failure analysis project. At the end of the summary, microXRF data will be provided as a means for comparison and a thought exercise on a use-case scenario to bolster the analysis.
Background
On January 27, 2022, a failure analysis laboratory received a set of six 316L stainless steel piping sections from a food and beverage facility in New Jersey. These pipe sections were extracted from a piping system exhibiting external discoloration near circumferential field welds and experiencing multiple leaks (Figure 2). The system was designed to receive city water, store it in a white fiberglass tank, recirculate it, and inject chlorine at a target concentration of 1.5 ppm. The treated water passes through filtration processes, including 5-micron filters and activated charcoal towers, to remove chlorine residuals and other impurities. After approximately 36 hours of use, the towers required regeneration through high-temperature steam treatment, a portion of which was discharged into the room. Following this, the water underwent additional treatment steps, including polishing and reverse osmosis, with the addition of calcium carbonate to enhance conductivity for magnetic flowmeters.
It’s worth noting that while the target chlorine injection concentration was 1.5 ppm, there were instances where the facility failed to detect additions exceeding alarm limits until reaching 4 ppm. Moreover, there was a period when the meter malfunctioned, maintaining a constant reading of 0.1 ppm, allowing unmonitored chlorine injection into the system. The samples sent to the laboratory for analysis were collected from the piping section between the city water holding tank and the carbon tower, representing the segment with the highest impurity and oxidant levels and, hence, the most susceptible to corrosion. Notably, the piping downstream of the carbon tower did not exhibit discoloration or known damage.
The laboratory‘s role in this investigation was to assess the damage mechanisms present in the submitted pipe sections and gather pertinent data to support the ongoing inquiry into the cause of leaks and other damages.
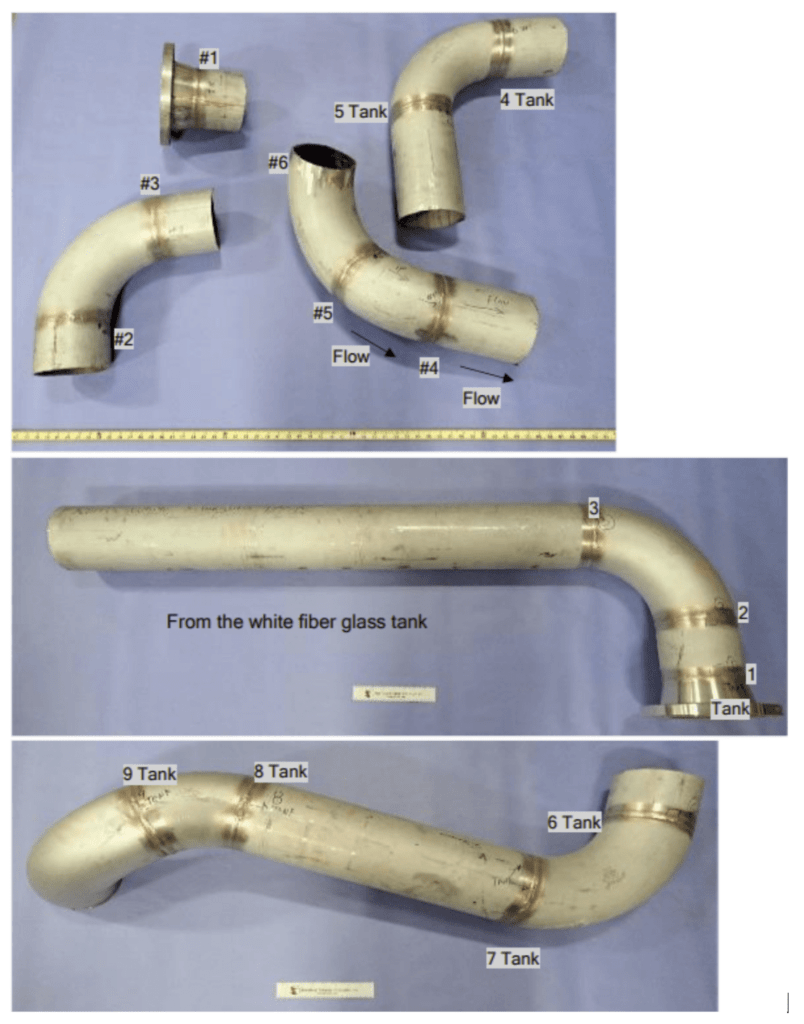 Figure 2. As-received photographs of the various pipe sections.
Examination Procedures and Results
The laboratory generally followed a standard failure analysis process for evaluating these samples (Figure 3).
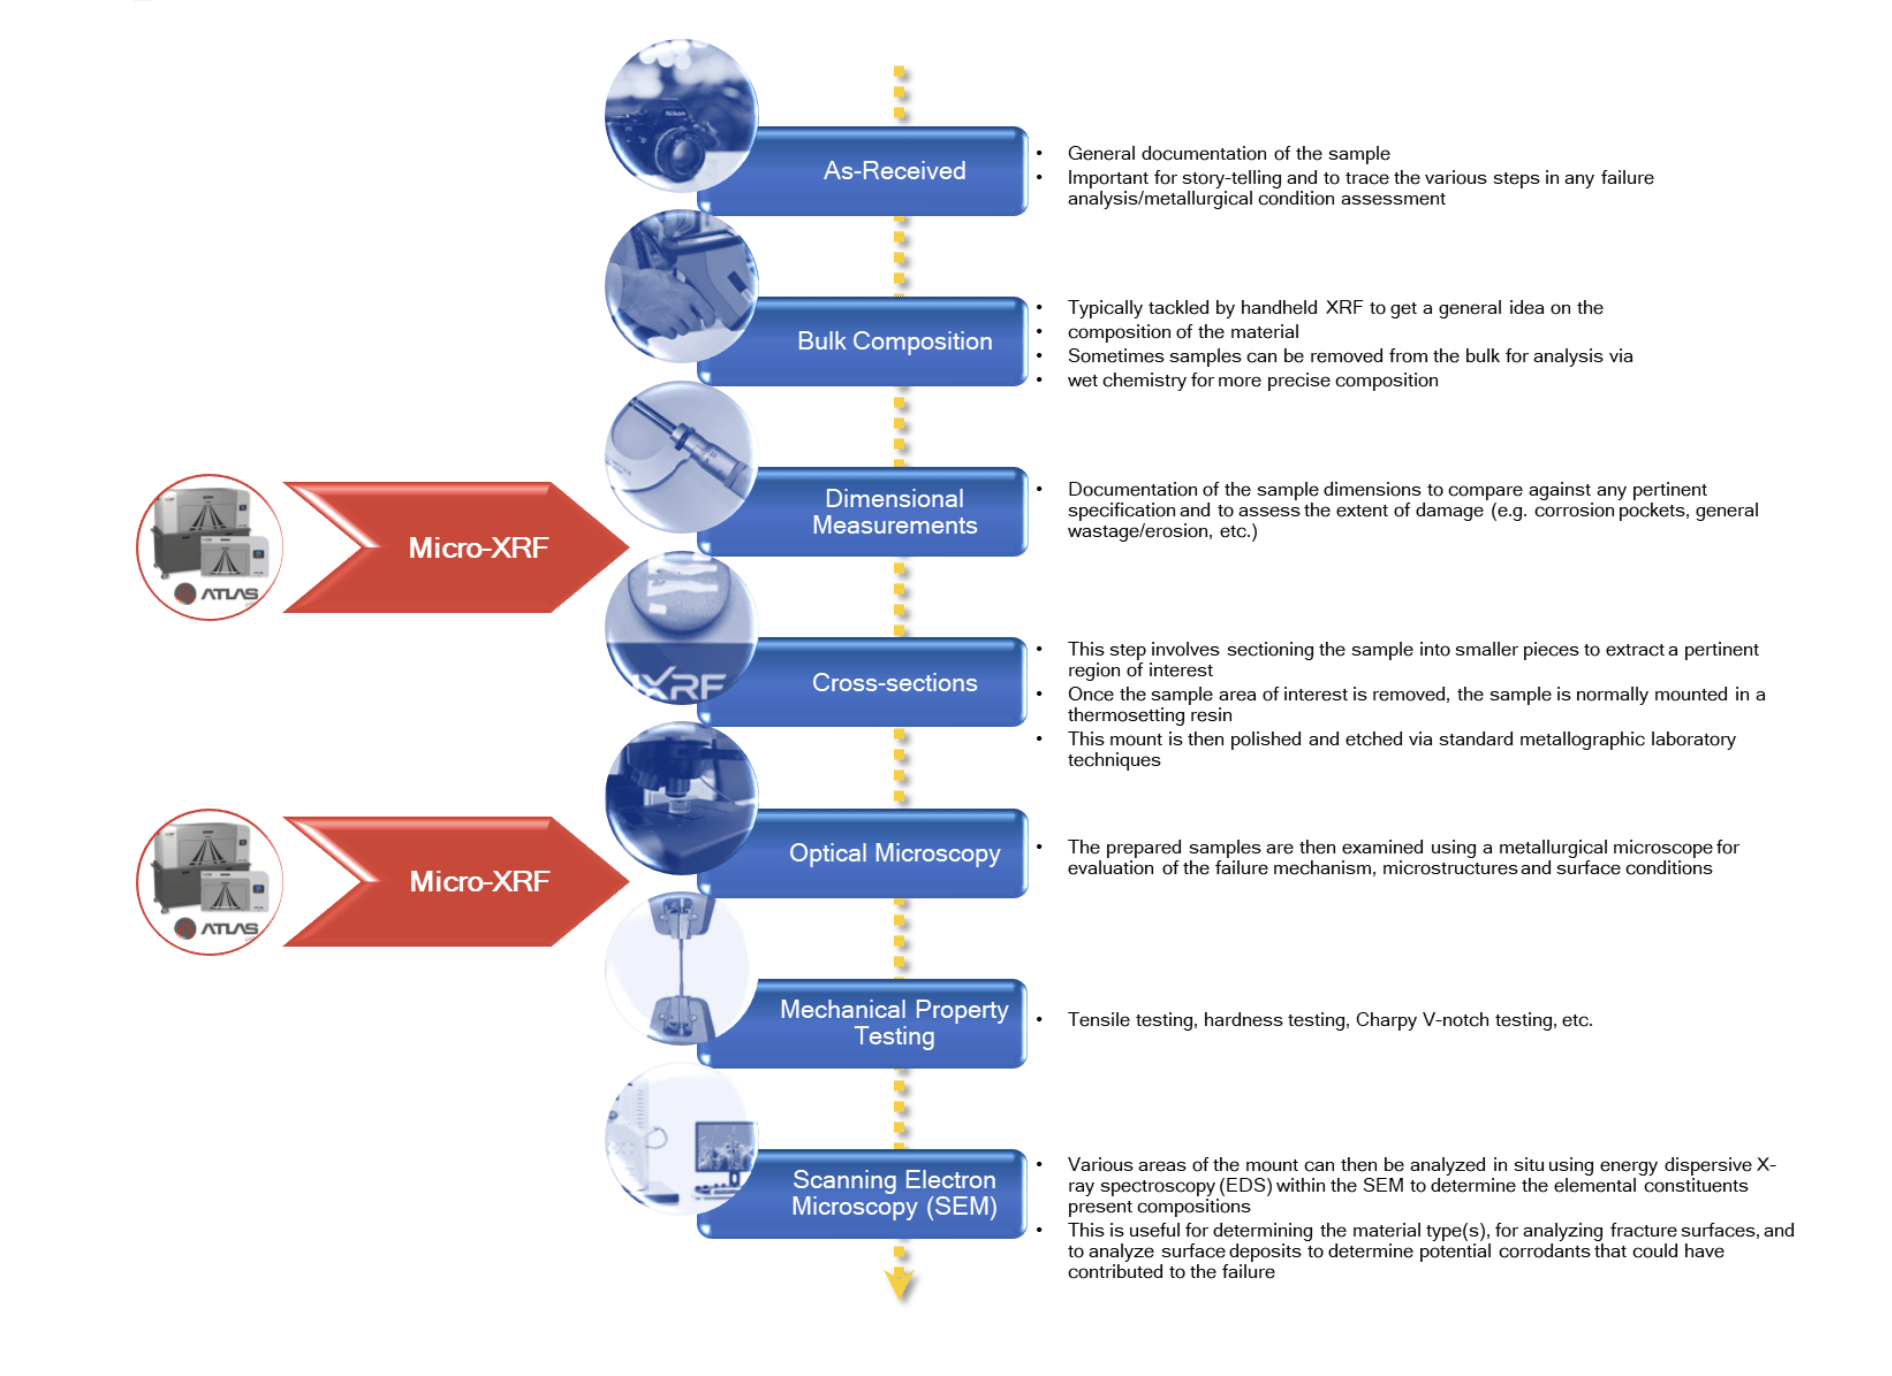
Figure 3. A flow chart that shows common steps in evaluating ferrous-based components.
During the visual analysis, each pipe section displayed varying degrees of discoloration around circumferential welds. The pipe sections were also stamped/sourced from different manufacturers. In general, three main issues were identified:
- Section 1-1: This section exhibited through-wall pits, primarily on the bottom side of the horizontal pipe and on the elbow between the flange and the straight section (Figure 4 and Figure 5). The pits appeared to be internally initiated and were documented through visual inspection and metallographic examination.
- Sections 2, 3, and 4: These sections had deposit mounds with a sea-shell appearance called tubercles located near, but not at, the welds (Figure 6 and Figure 7). The pits appeared to be internally initiated and were documented through visual inspection and metallographic examination.
- External Discoloration: Discoloration was observed on both sides of every circumferential weld. One section was examined for external discoloration, revealing material buildup/rust with significant chlorine content.
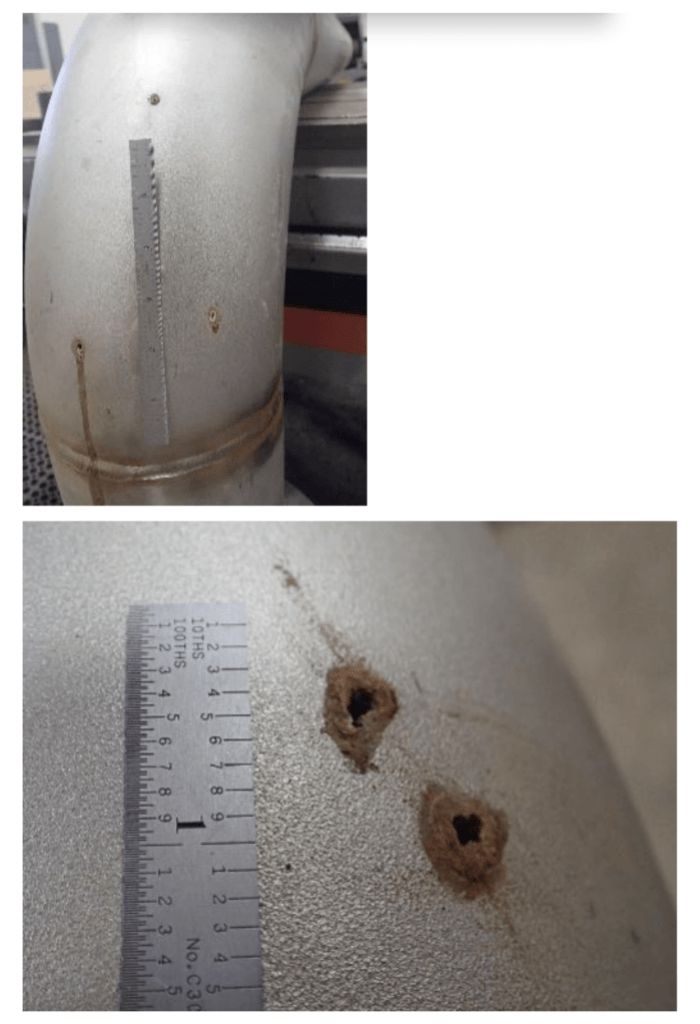
Figure 4. As-received photographs showing some of the through-wall pitting.
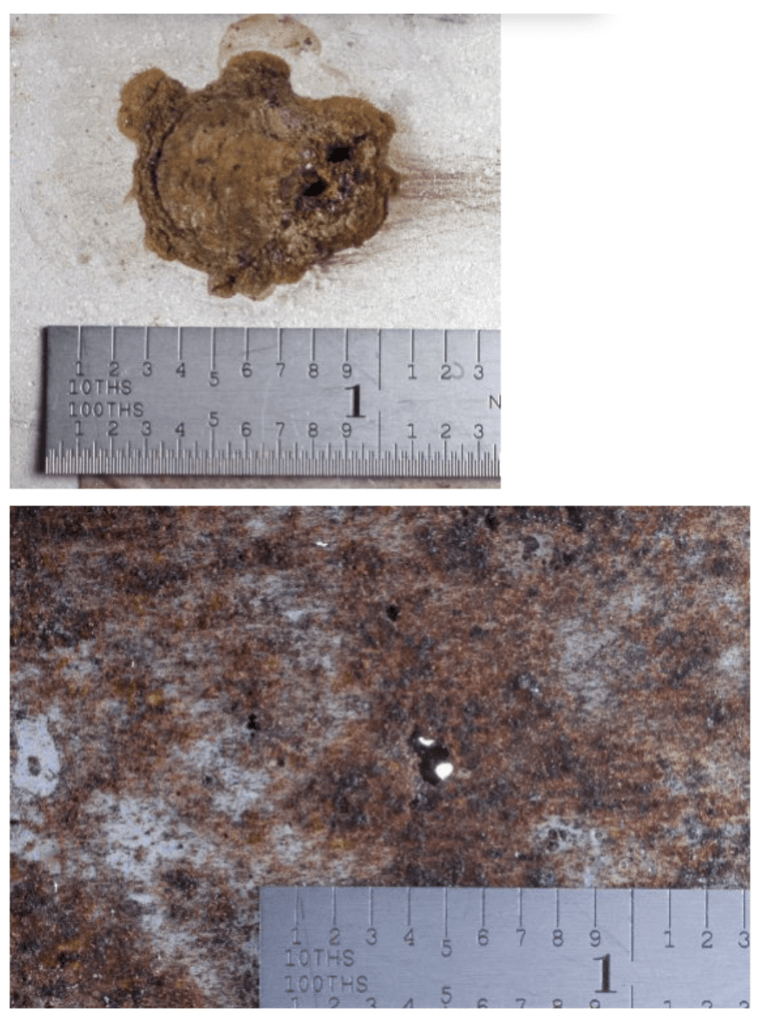
Figure 5. Closer views of a through-wall pit from the external (upper) and internal (lower) surfaces.
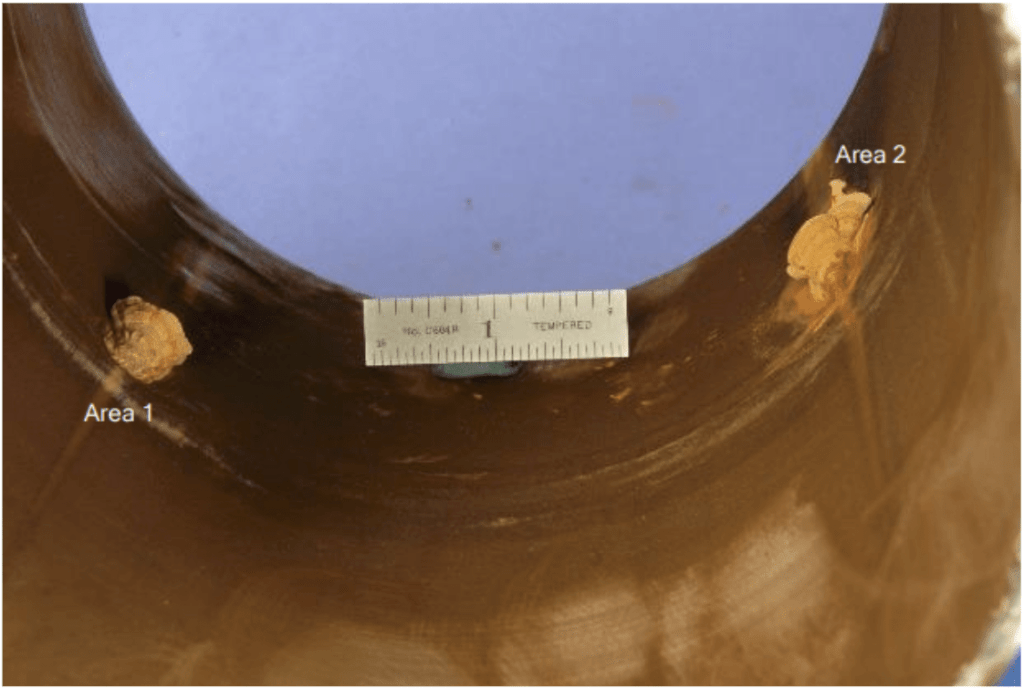
Figure 6. Views of the internal surface with material buildup (tubercles) near, but not at, the welds.
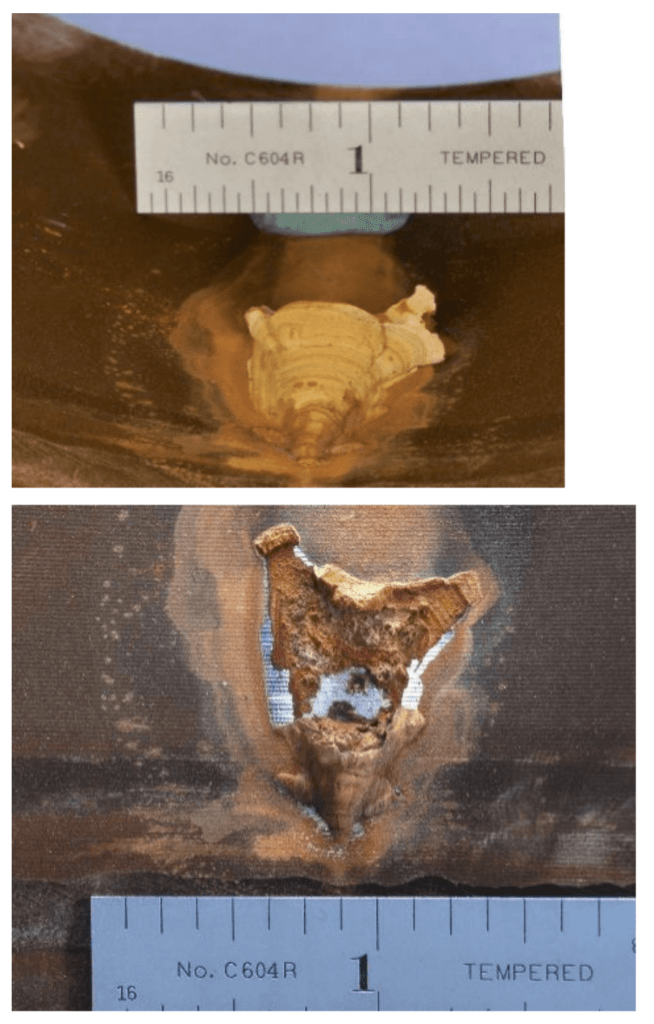
Figure 7. Closer views of the tubercle(s) buildup. The shiny metal beneath part of the tubercle (dislodged during handling) is indicative of active corrosion.
Further analysis involved compositional assessments using X-ray fluorescence (XRF), microscopic examinations of pits, metallographic analysis, and scanning electron microscope (SEM) examinations of deposits. Results revealed that the pits in Section 1 were internally initiated, with chlorine-induced stress corrosion cracking characteristics. Tubercles on Section 2-4 were located near the weld and exhibited mild preferential propagation along lines of cold work, with no preferential attack of weld metal. Figure 8 through Figure 10 provide examples of the metallography and SEM elemental maps for the ID-initiated damage. The external discoloration was linked to chlorine content but did not exhibit significant corrosion.
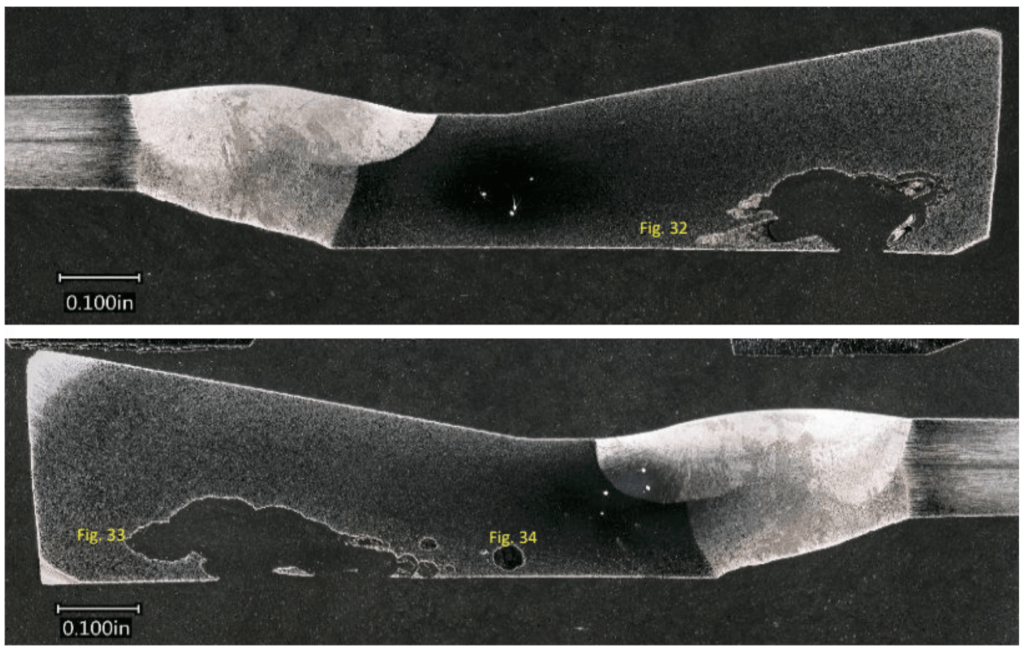
Figure 8. Mating metallographic cross-sections from Section 2 after mounting, grinding, polishing, and etching. Prominent pitting with an undercut morphology was noted along the ID surface (where the tubercles were located).
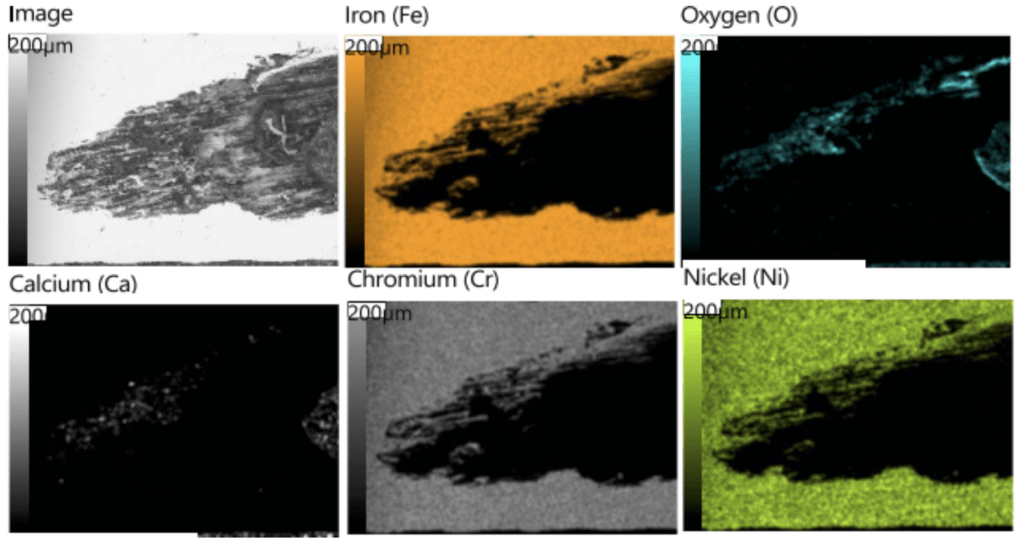
Figure 9. SEM elemental maps from the region notated ‘Fig. 32‘ in Figure 8.
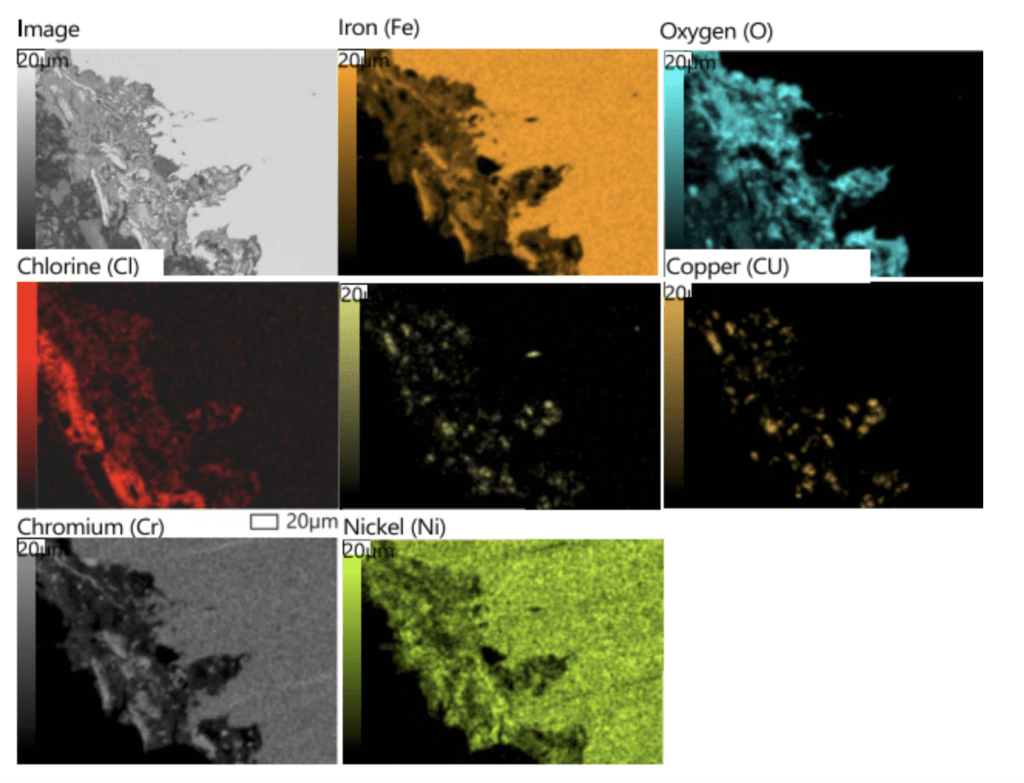
Figure 10. SEM elemental maps from a random region in Figure 8.
Failure Analysis Laboratory Summary
Ultimately, the pitting on the internal surface was related to the presence of chlorine. It was determined that no material discrepancies were associated with the ID corrosion.
MicroXRF on Section 2
The metallurgical cross-section from Section 2 was documented in the as-received condition (Figure 11). This assessment aimed to determine if additional information could be extracted from this technique, either to aid as a precursor for SEM-EDS or to circumvent that technique (see Figure 3). The mount shows both cross-sections collected through a tubercle’s center. Note that the ID surfaces are adjacent to each other in the mount.
From a holistic perspective, the entire section of the ID corrosion was scanned on one of the mating surfaces2. Collected at ~10 micron spatial resolution, a full map view of all of the elements present and several select overlays/fire displays are outlined in Figure 12 through Figure 14. One immediate discrepancy with the SEM-EDS data from this same region are prominent amounts of copper and chlorine (reference Figure 8, where no copper or chlorine are present). Scanning this entire region allows the end-user to further explore and interrogate different regions with micro-XRF or SEM-EDS.
Further micro-XRF interrogation was then performed by collecting a sub-map of the region with extensive chlorine and copper present – this was collected at ~5 micron spatial resolution. A full map view of all the elements present and several select overlays/fire displays are outlined in Figure 15 through Figure 17. Within this further interrogation, it became more apparent that the base metal ahead of the corrosion had the presence of MnS inclusions. A scatter plot analysis offers another view of the relationship between Mn and S – see Figure 18 and Figure 19. These MnS inclusions ranged from ~5-50 microns. ![]()
Figure 11. As-received photograph of the Section 2 mount from the failure analysis laboratory.
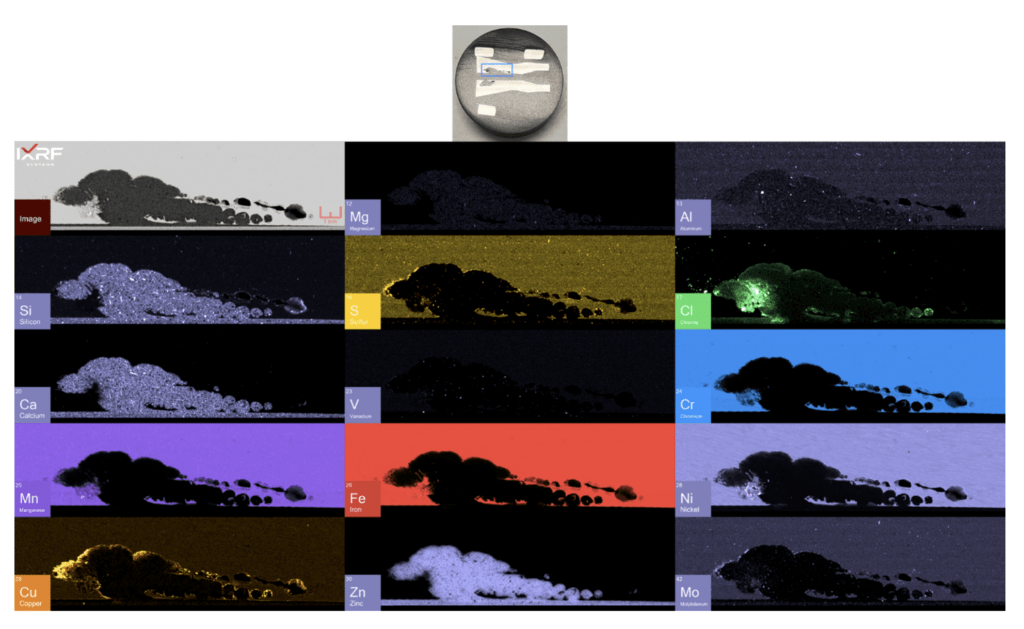
Figure 12. Full map view of the select region of ID corrosion (blue box on the mount) from Section 2.
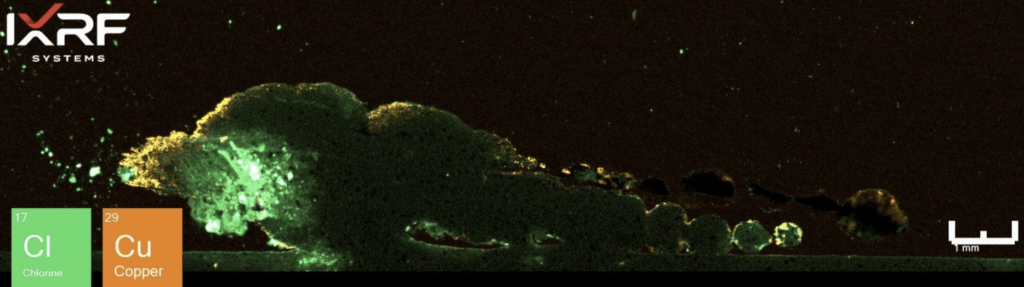
Figure 13. Elemental overlay of Cl and Cu from the select region of ID corrosion (blue box on the mount) from Section 2.
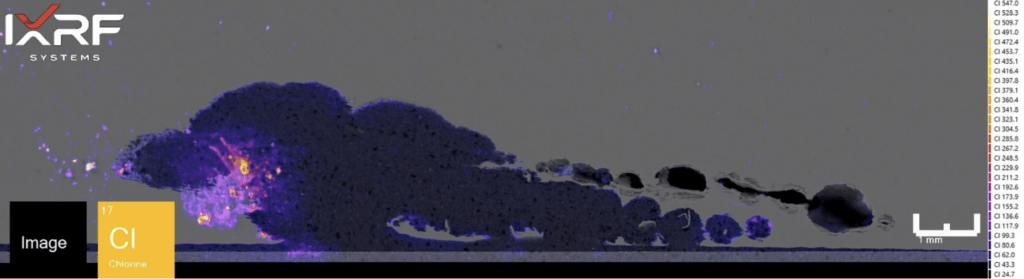
Figure 14. Fire display of Cl from the select region of ID corrosion (blue box on the mount) from Section 2.
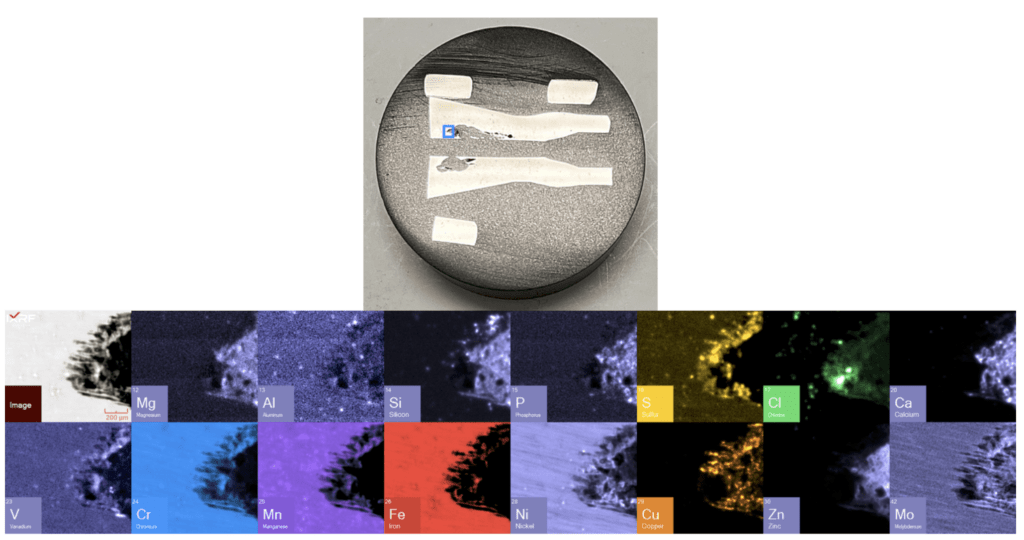
Figure 15. Sub–map view of the select region of ID corrosion (blue box on the mount) from Section 2.
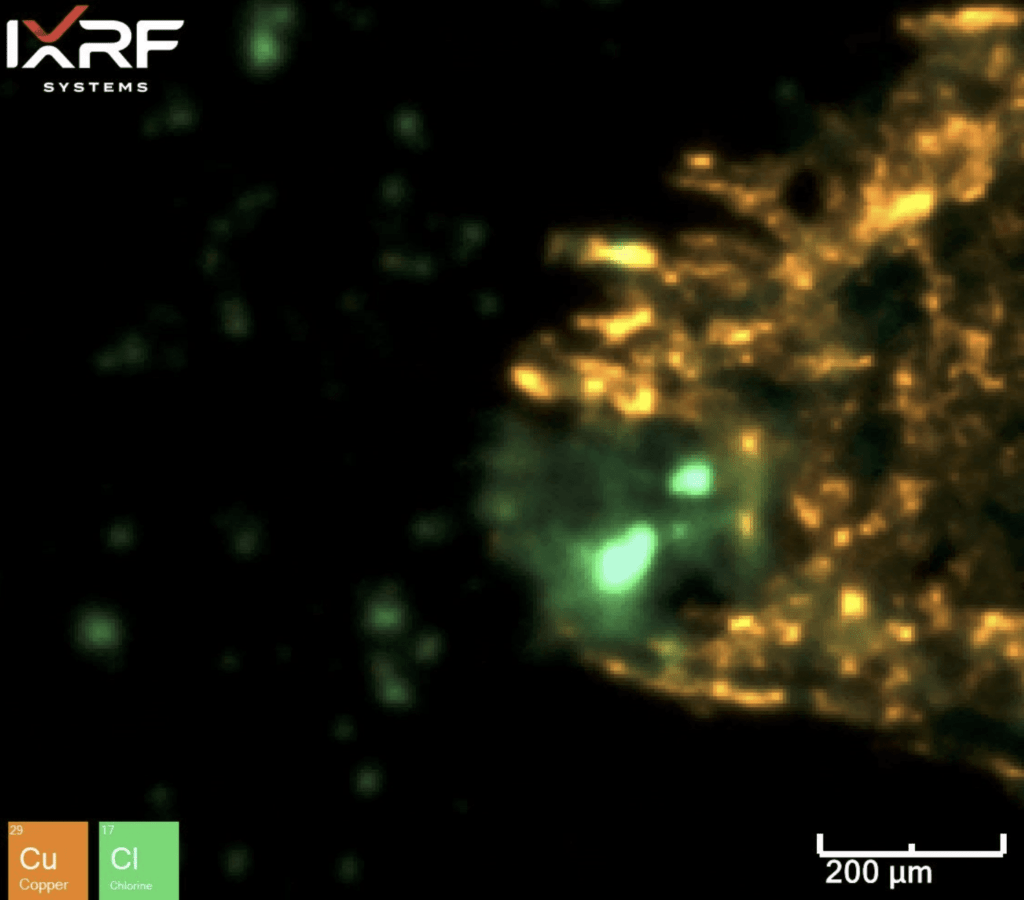
Figure 16. Elemental overlay of Cl and Cu from the select sub–map region of ID corrosion (blue box on the mount) from Section 2.
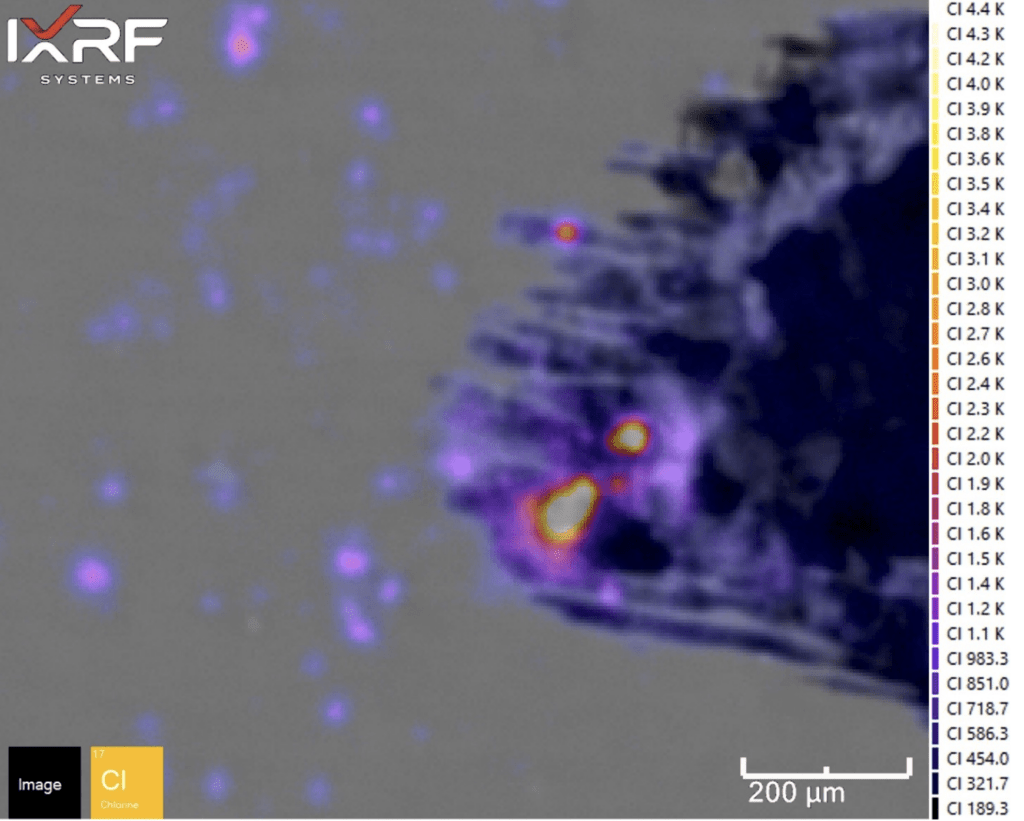
Figure 17. Fire display of Cl from the select sub–map region of ID corrosion (blue box on the mount) from Section 2.
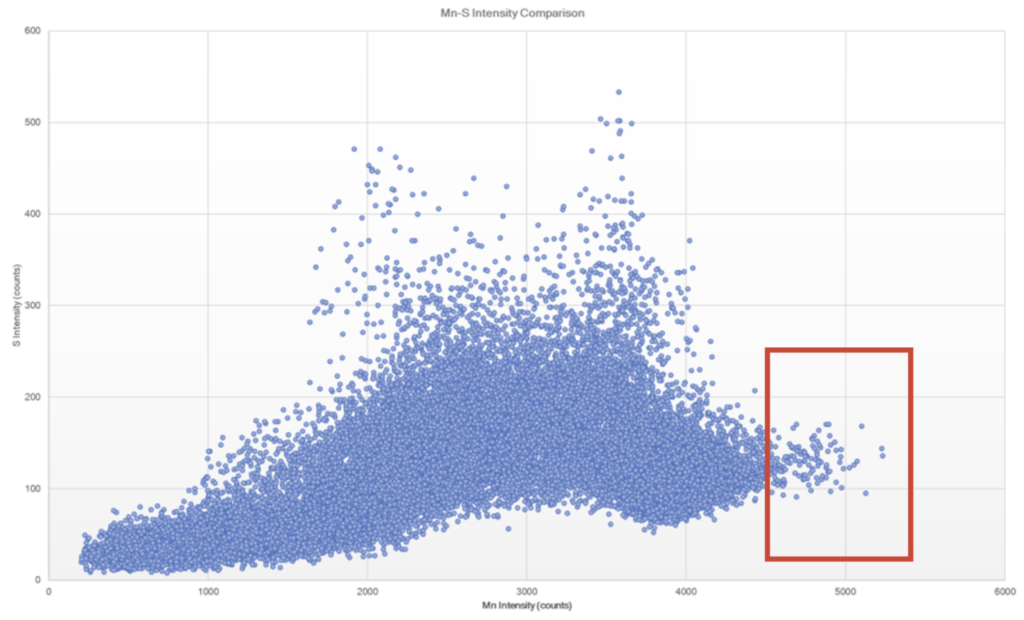
Figure 18. Scatter plot of Mn and S intensities to help identify regions of co-location. Note that the red box appears to bound the region of MnS inclusions, whereas some of the higher intensity S regions appear to be associated with the ID corrosion cell.
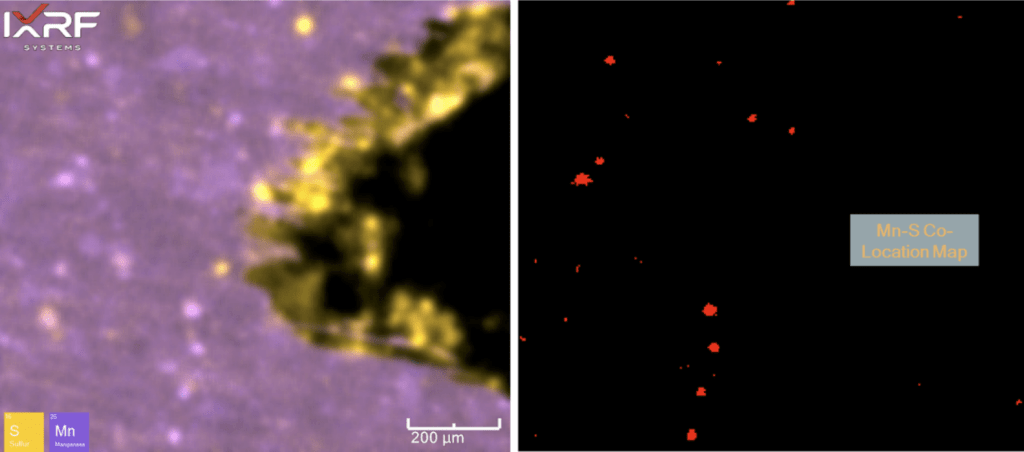
Figure 19. Elemental overlay of Mn and S from the select sub–map region of ID corrosion (blue box on the mount) from Section 2. A co-location map for Mn and S is also provided (right), coinciding with the scatter plot region in Figure 18.
The Missing Link?
When identifying contaminants and damage mechanisms in the context of materials exposed to complex environments, scanning electron microscopy with energy-dispersive X-ray spectroscopy (SEM-EDS) is often a valuable tool. However, it comes with certain limitations. One significant challenge is exploring various magnifications and hunting around to locate pertinent regions within a sample. Other challenges often surround the limited ability to excite elements beyond 3 keV (unless present in high concentrations), small chambers, and the requirement to run under vacuum. Therefore, using the SEM can sometimes be time-consuming, and the results can be inconclusive.
While the micro-XRF technique indeed corroborated the basic findings of the failure analysis laboratory, it is important to mention that it identified discrepancies AND offered a glimpse at the potential for a deeper dive. This has real-world implications as it can help guide run, repair, and replace decisions and, in this particular case, try to understand the differences in elemental distribution between manufacturers. Another powerful aspect in the failure analysis world is gaining as much knowledge as possible about your sample BEFORE making cross-sections. Micro-XRF has the ability to see globally but also the ability to delve into high spatial resolutions to ensure that aspects of the analysis are not overlooked.
This article represents just one straightforward look at leveraging this technology and the software behind it. That said, there are numerous ways to use this technology to optimize the analysis and discovery by adjusting the acquisition parameters, leveraging filters, etc. Overall, microXRF technology is poised to usher in a new era of precision and comprehensiveness in analyzing ferrous-based components as a true ‘disruptor.’ Its unique capabilities, including high spatial resolution elemental mapping, non-destructive analysis, the ability to scan larger areas, and the utilization of powerful X-ray sources, make it a valuable addition to the tools used in metallurgy and failure analysis. As technology advances, so does our capacity to uncover the intricate secrets hidden within the very materials that power our world.
Voisin, T., Shi, R., Zhu, Y. et al. Pitting Corrosion in 316L Stainless Steel Fabricated by Laser Powder Bed Fusion Additive Manufacturing: A Review and Perspective. JOM 74, 1668–1689 (2022). https://doi.org/10.1007/s11837-022-05206-2
Corrosion, Vol. 13, ASM Handbook, ASM International, 1987, p 547-565 (overview of stainless steels), 1226-1231 (pharmaceutical industry)
J.R. David, Ed., ASM Specialty Handbook: Stainless Steels, ASM International, 1994, p 133-180 (atmospheric and aqueous corrosion)
A.J. Sedriks, Corrosion of Stainless Steels, John Wiley & Sons, 1979
IXRF Systems
Bringing Clarity to Complexity
IXRF Systems is a leading provider of X-ray fluorescence instrumentation. With our advanced analytical solutions, we are committed to supporting research, quality control, and educational endeavors across various industries. Click here to contact us today to get a deeper understanding of how our technology can be a valuable addition to your analytical toolkit.