MicroXRF for Energy Materials Research
Map elemental composition across battery electrodes, photovoltaic thin films, fuel cell catalysts, membrane assemblies, and emerging energy materials.
IXRF Systems' Atlas Apex microXRF instruments help energy researchers determine which elements are present, where they are distributed, and how that distribution changes with processing, cycling, and degradation.
With elemental coverage from carbon through uranium, Atlas Apex detects most transition metals, dopants, catalyst materials, and contaminants used in energy-storage and conversion technologies. The analysis is non-destructive, allowing samples to be retained for additional testing or complementary characterization.
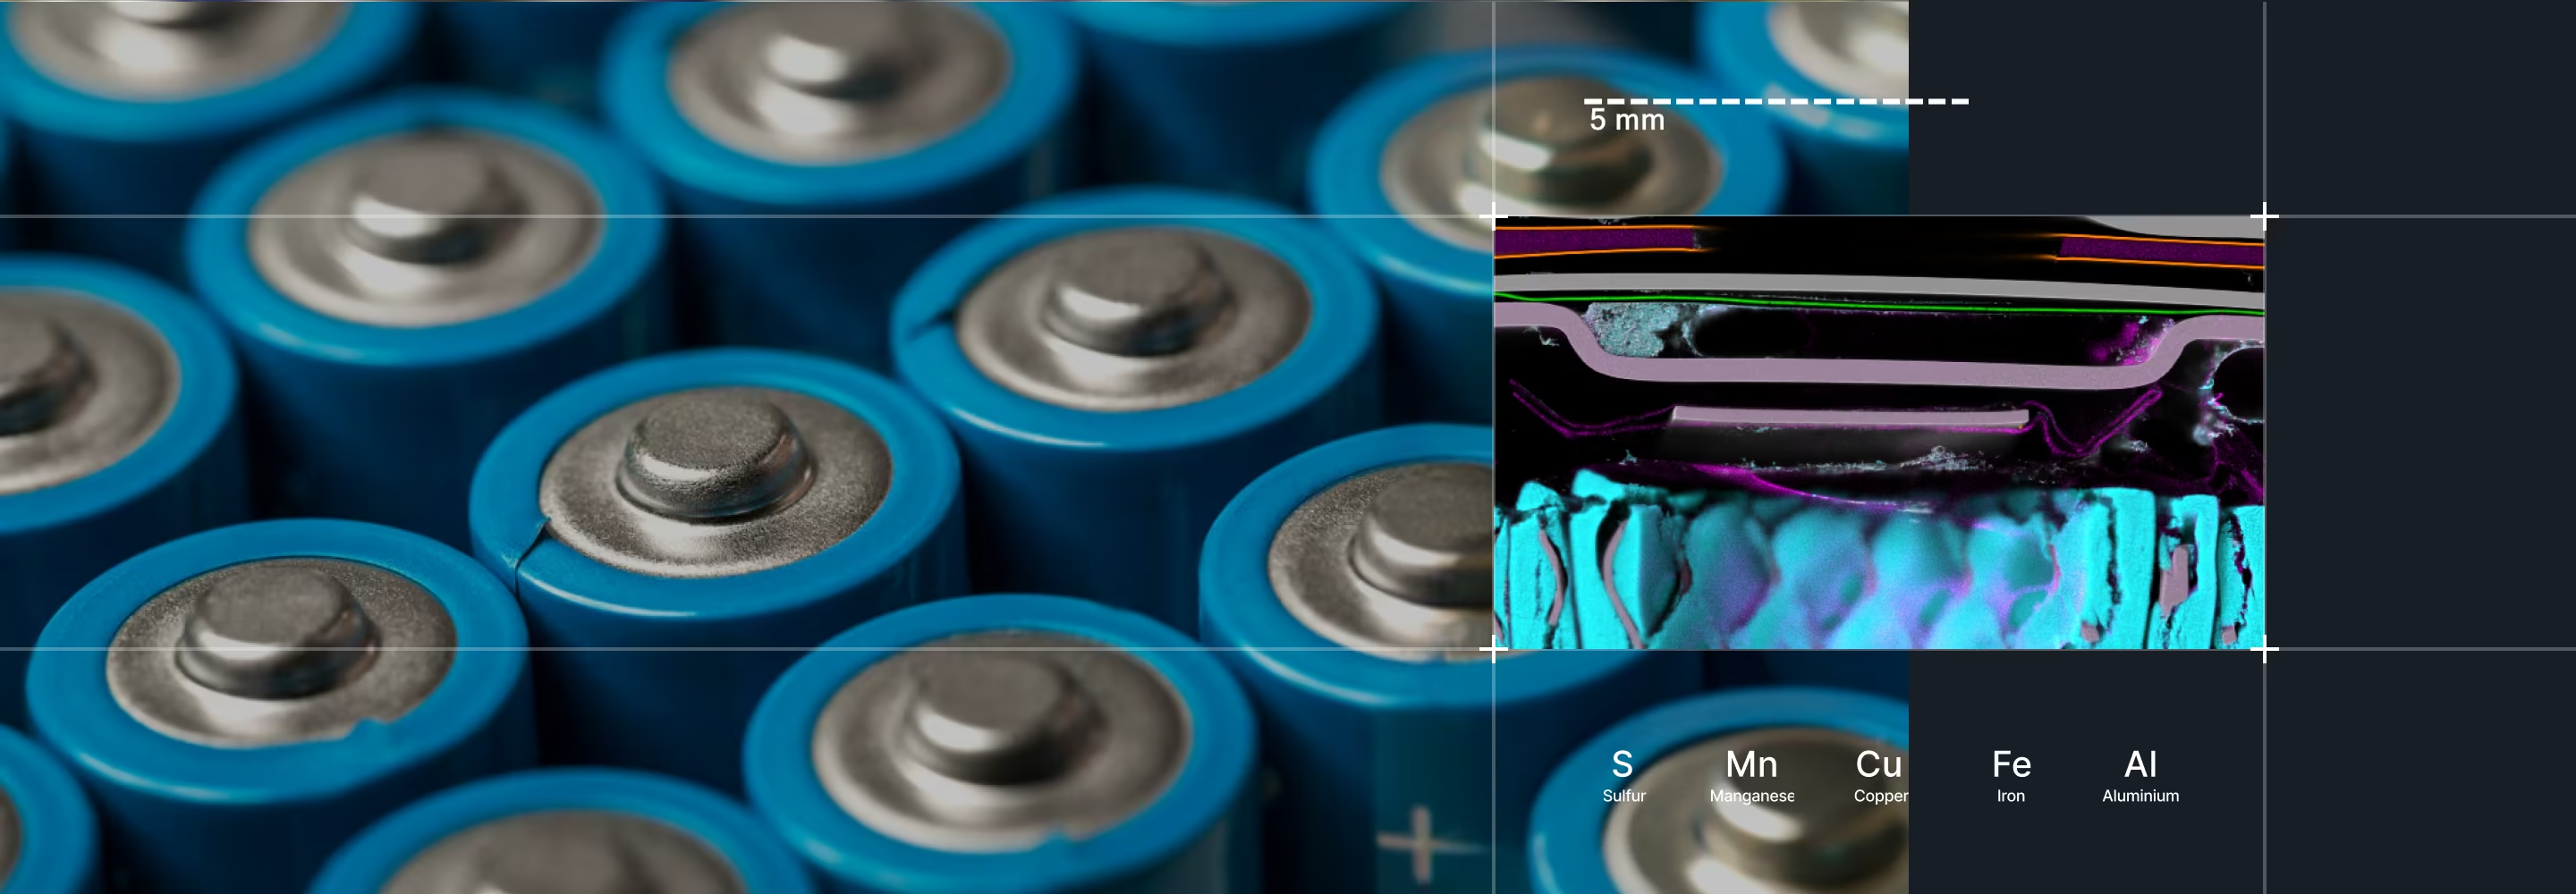
Why Elemental Distribution Matters for Energy Materials
MicroXRF preserves this spatial information by mapping the material directly. Researchers can connect localized chemistry with the physical structure and performance of the sample.

Energy materials are rarely uniform.
A bulk measurement can confirm the average composition of an electrode, thin film, or catalyst layer, but it cannot show where a coating became uneven, where a dopant accumulated, or where an element migrated during use. These spatial differences can affect:
- Device efficiency
- Energy-storage capacity
- Charge transport
- Catalyst utilization
- Manufacturing yield
Energy Materials MicroXRF Maps
Battery Electrodes & Energy Storage
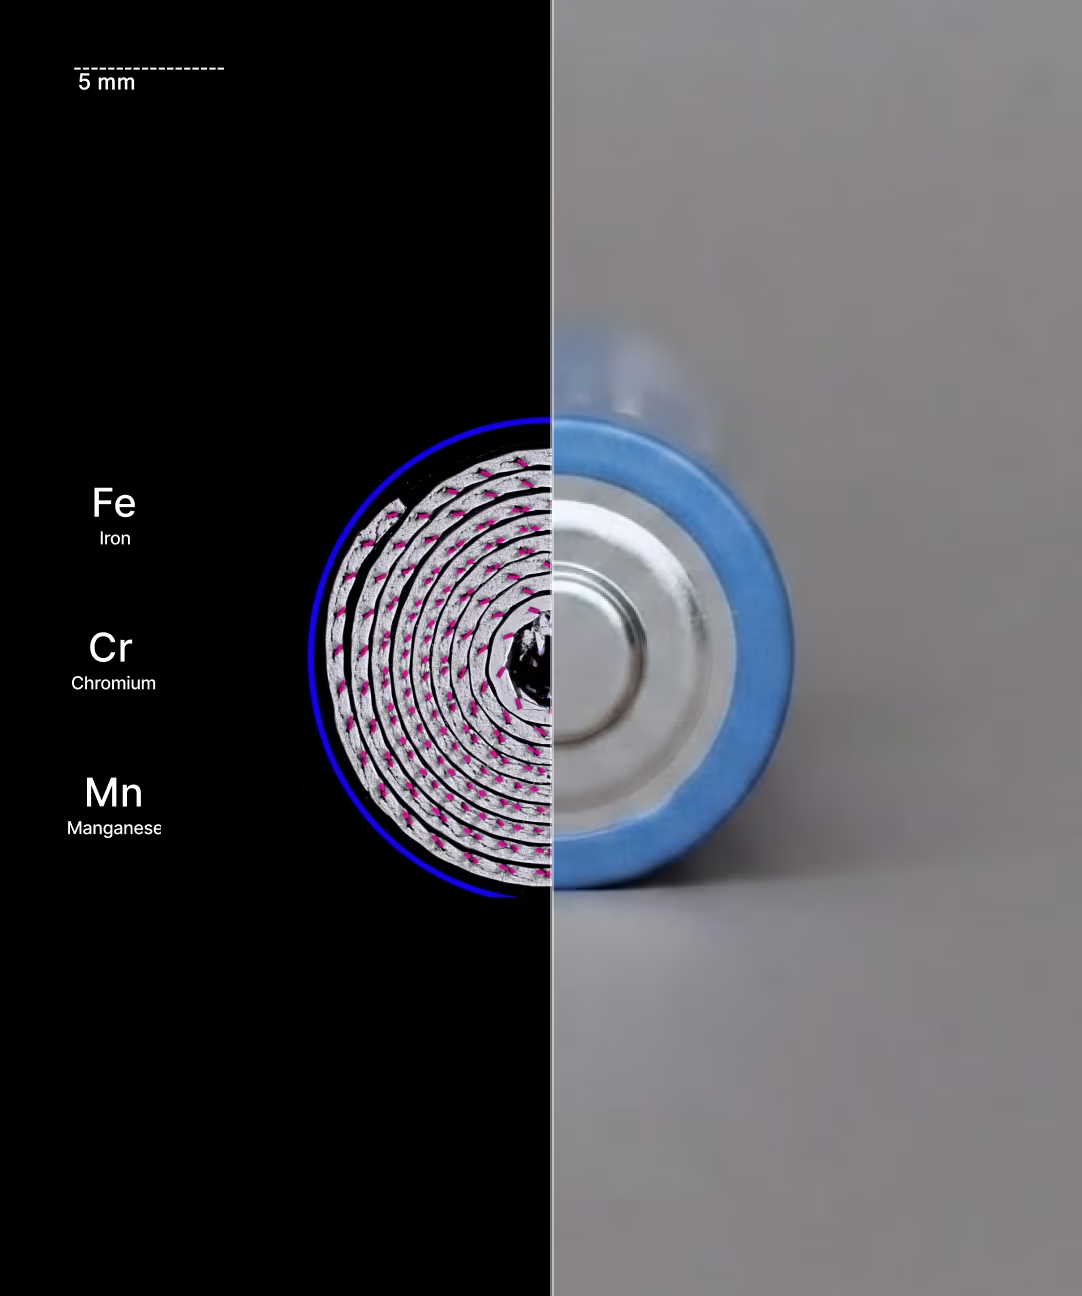
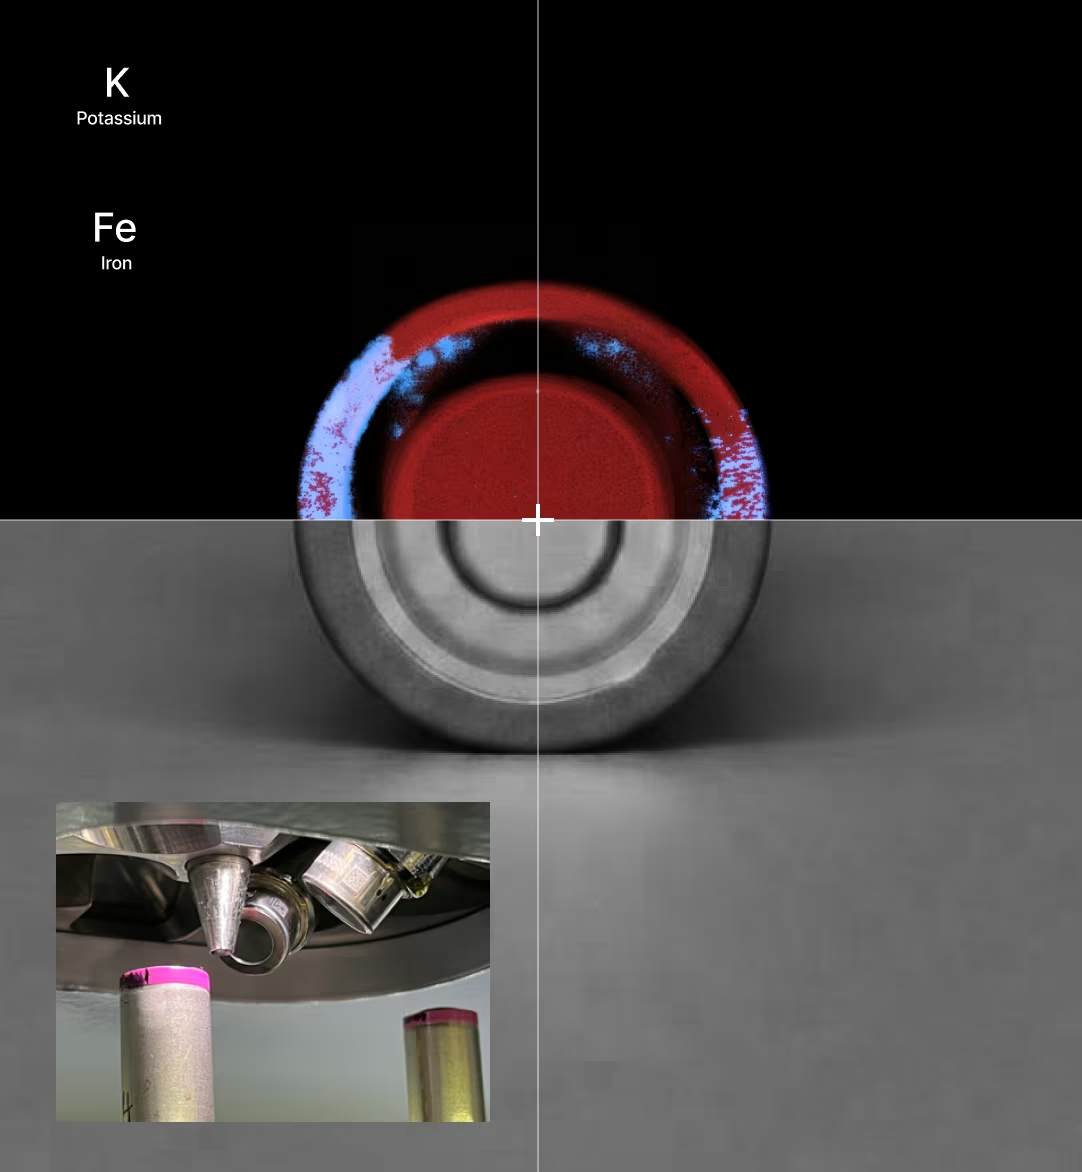
MicroXRF maps transition metals, current-collector materials, coatings, and contaminants across battery electrodes and cell components. Depending on the battery chemistry, elements of interest may include:
- Nickel
- Cobalt
- Manganese
- Iron
- Aluminum
- Phosphorus
- Sulfur
- Copper
Elemental maps can reveal electrode-coating variation, current-collector defects, contamination, and transition-metal crossover between cell components.
For detailed information about lithium-ion and solid-state battery workflows, visit our Battery Materials page.
Photovoltaic and Thin-Film Solar Materials
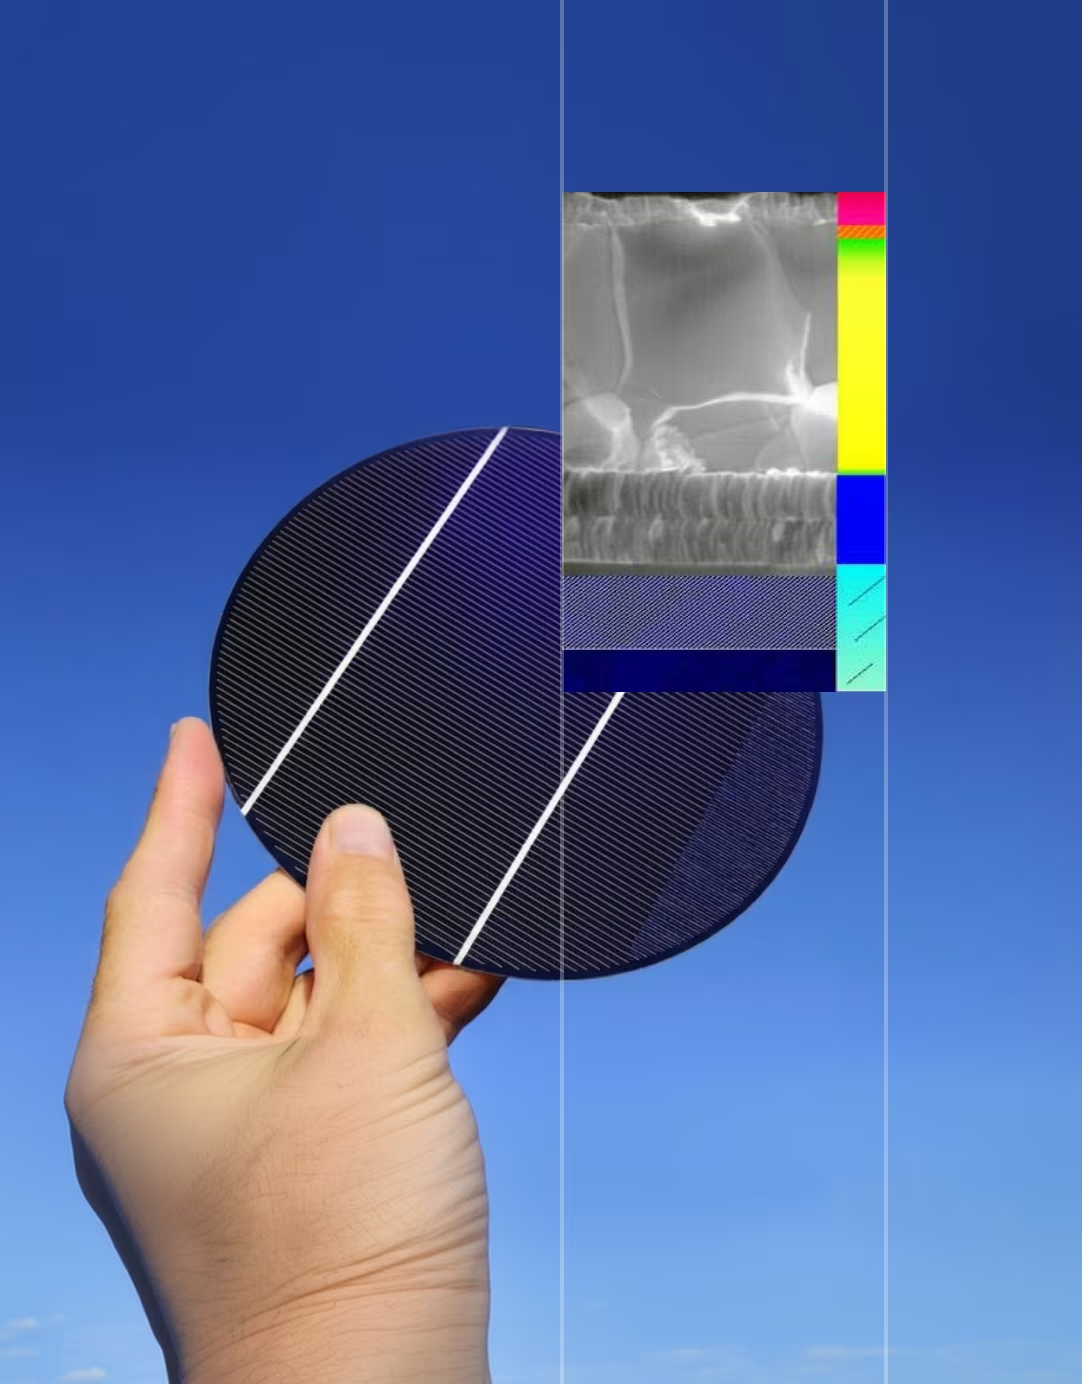
Solar-cell performance depends on maintaining consistent composition across active layers, interfaces, and complete device areas. MicroXRF can map elements used in thin-film photovoltaic technologies, including:
- Cadmium and tellurium in CdTe cells
- Copper, indium, gallium, and selenium in CIGS materials
- Lead and heavier halide-related elements in perovskite systems
- Metallic contacts and conductive layers
- Dopants and processing contaminants
A full elemental map can reveal gradients, deposition non-uniformity, edge effects, localized contamination, and compositional differences between working and underperforming regions.
In perovskite solar research, microXRF can support the study of lead distribution and other detectable elemental changes associated with film formation and degradation. Complementary techniques may still be required to characterize molecular structure, crystallinity, and elements outside the detectable range.
Fuel Cell Catalysts and Membrane Assemblies
Platinum-group metals represent a significant portion of fuel-cell catalyst cost and performance. MicroXRF can map platinum and other catalyst elements across catalyst layers, gas-diffusion electrodes, and membrane electrode assemblies. This helps researchers evaluate:
- Catalyst loading
- Coating uniformity
- Platinum-rich and platinum-deficient regions
- Catalyst redistribution
- Localized material loss
- Manufacturing defects
- Differences between new and aged assemblies
Large-area mapping can determine whether the catalyst is evenly distributed across the active region rather than relying on a small number of spot measurements.
Membranes and Membrane Electrode Assemblies
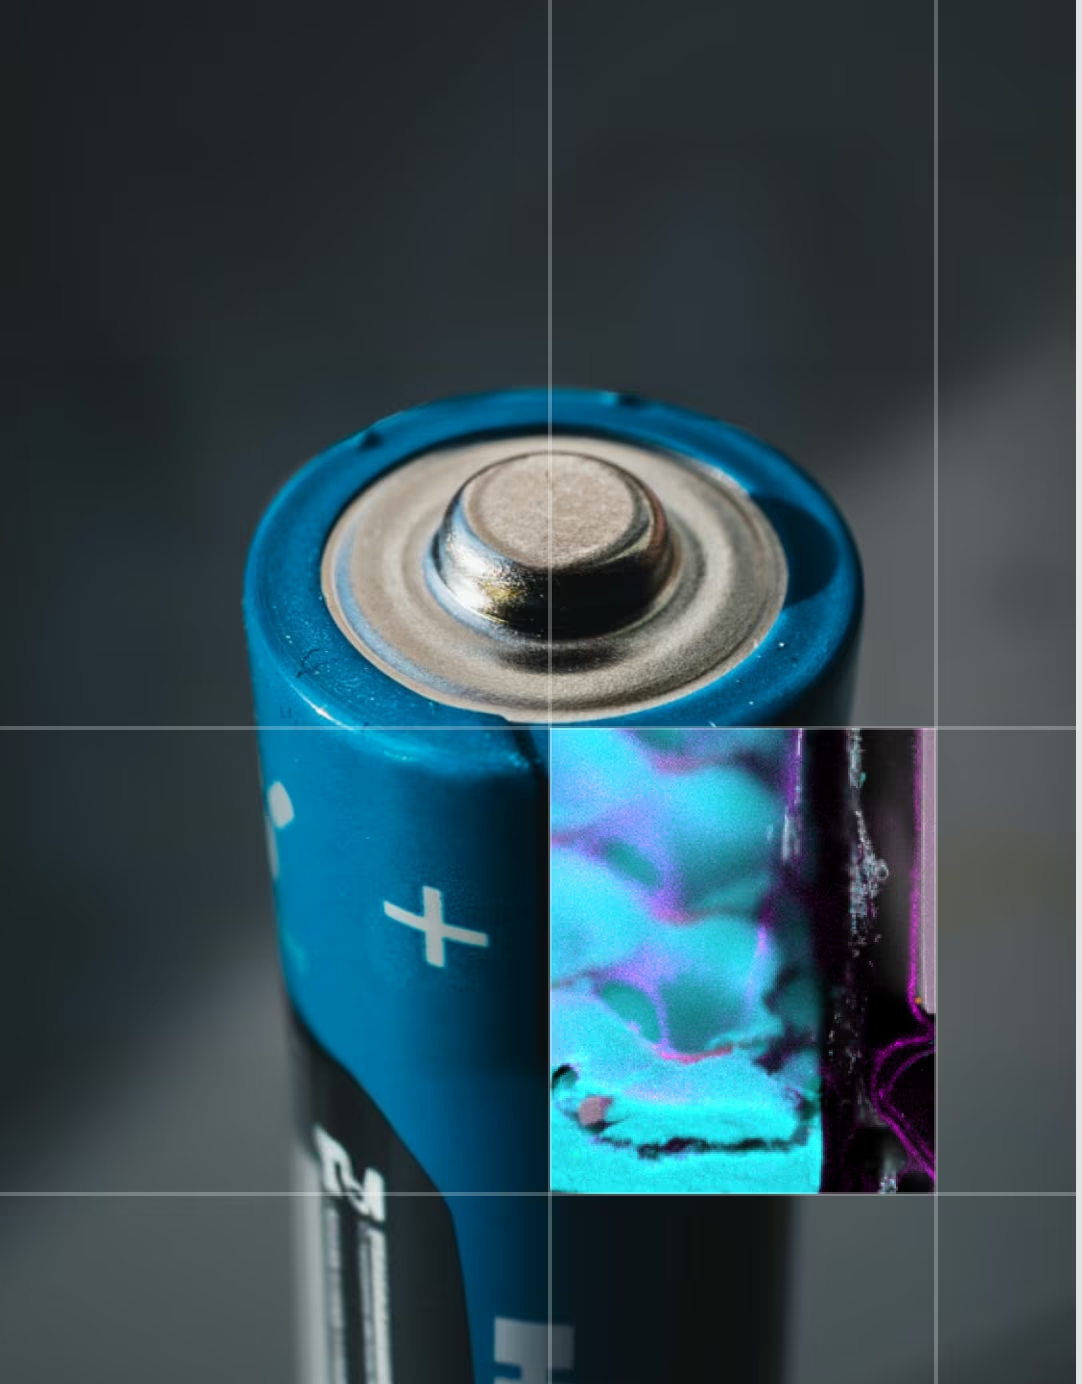
Membrane electrode assemblies combine catalysts, ionomer materials, porous supports, and other functional layers. MicroXRF can map detectable elements across these structures, including platinum within the catalyst layer and sulfur associated with some ionomer systems. Researchers can compare elemental distribution across:
- Catalyst-coated membranes
- Gas-diffusion layers
- Electrode interfaces
- Aged and unused assemblies
- Regions exposed to different operating conditions
The resulting maps help connect material distribution with manufacturing consistency and device degradation.
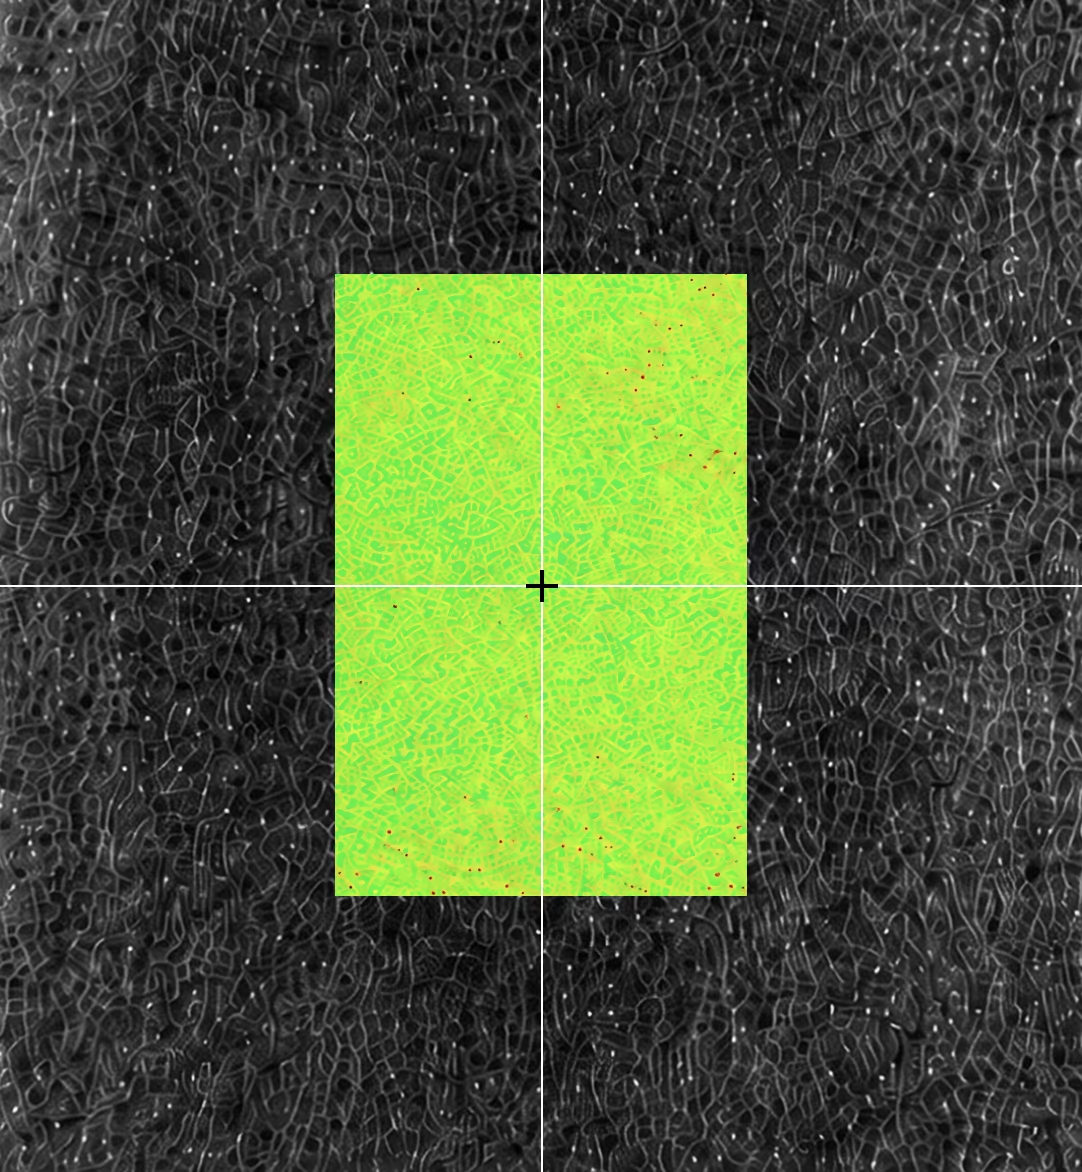
Emerging and Grid-Scale Energy Materials
MicroXRF can map compositional variation across emerging energy systems, including vanadium redox flow batteries, solid-state electrolytes, and thermoelectric materials.
Applications include evaluating vanadium crossover and membrane contamination, mapping sulfur, phosphorus, chlorine, and transition metals across electrolyte interfaces, and identifying dopant variation, segregation, processing contamination, and composition gradients.
Because microXRF preserves spatial information and stores a full spectrum at every pixel, it can compare new and aged materials and reveal where detectable elements accumulate, migrate, or become non-uniform.
How MicroXRF Analysis Works
Atlas Apex uses a focused X-ray beam to identify and map elemental composition across a sample — from a single coating boundary to a complete device.
- 01.
Choose the environment — air, vacuum, or helium — based on the elements you need to detect.
- 02.
Resolve fine features down to a 5 µm spot: coating boundaries, contamination, catalyst regions, and thin-film defects.
- 03.
Scale up to automated large-area mapping across full electrodes, solar cells, membrane assemblies, and device cross-sections.
- 04.
Revisit the data anytime — a complete spectrum is stored at every pixel, so new maps don't require a new measurement.
MicroXRF Compared With Other Energy-Materials Methods
vs. SEM-EDS
SEM-EDS provides finer spatial resolution and combines elemental analysis with electron imaging. It is well suited to small particles, interfaces, and microstructural features.
MicroXRF accommodates larger samples and maps wider areas without requiring a conductive coating — useful for full electrodes, solar cells, membrane assemblies, and non-conductive components such as separators and catalyst supports. The two techniques are often complementary: microXRF can identify regions of interest across the complete sample before selected areas are examined at higher resolution with SEM-EDS.vs. ICP-MS or ICP-OES
ICP methods provide sensitive and precise bulk concentrations after the sample is digested. For example, ICP may quantify the total amount of a transition metal dissolved in an electrolyte — but it cannot show where that metal originated or where it accumulated on an electrode.
MicroXRF preserves the sample and provides the missing spatial information. Researchers may use both methods when they need accurate bulk concentration and elemental distribution.vs. XPS
XPS provides detailed information about surface composition and chemical state within a shallow analysis depth. MicroXRF penetrates more deeply and covers a much larger sample area, but it does not provide the same oxidation-state or surface-chemistry information.
XPS is valuable for studying chemical state at a selected surface; microXRF is valuable for locating elemental variation across the broader sample.vs. XRD
XRD identifies crystalline phases and provides information about material structure. MicroXRF identifies and maps elemental composition — it can show where nickel, cobalt, platinum, vanadium, or other detectable elements are located, but it does not independently determine the crystalline phase containing them. Combining XRD and microXRF connects phase identification with spatial elemental distribution.
See What MicroXRF Can Map in Your Energy Material
Describe your material system, sample geometry, elements of interest, and research objective to an IXRF applications scientist. Our team can help determine whether microXRF is appropriate, recommend a measurement approach, and discuss sample feasibility before instrument selection.
Explore the Atlas Apex microXRF platform or visit our dedicated Battery Materials page for lithium-ion and solid-state battery characterization.
Atlas Apex systems are designed and manufactured in Austin, Texas, with applications and technical support provided directly by IXRF Systems.
Frequently
Asked Questions
MicroXRF can analyze a wide range of energy-related materials, including battery electrodes, fuel-cell catalysts, electrolyzer components, membrane electrode assemblies, solar cells, thin films, coatings, current collectors, catalyst layers, and energy-storage materials. Many can be examined with little or no destructive sample preparation.
MicroXRF provides large-area, non-destructive elemental mapping with minimal sample preparation, while SEM-EDS offers much higher spatial resolution for very small features. Researchers can use microXRF to locate compositional variations across an entire device or electrode and SEM-EDS for detailed follow-up analysis.
Yes. MicroXRF can map platinum, iridium, ruthenium, nickel, cobalt, and other catalyst-related elements across fuel-cell and electrolyzer components. This can reveal variations in catalyst distribution, loading, and spatial uniformity.
Yes. Elemental mapping can show how catalyst materials are distributed across electrodes, catalyst-coated membranes, and membrane electrode assemblies. Quantitative methods can also be used to evaluate relative or absolute loading when the sample structure and calibration approach are appropriate.
Yes. MicroXRF can characterize the elemental composition and uniformity of solar cells, photovoltaic layers, coatings, metallization, and thin-film materials. It can help identify compositional gradients, non-uniform deposition, contamination, and manufacturing-related variation.
MicroXRF can map many elements important to energy technologies, including Pt, Ir, Ru, Ni, Co, Mn, Fe, Cu, Zn, Ti, V, Cr, Al, Mg, Si, P, S, Se, Cd, In, Sn, and others. Detectability depends on concentration, sample matrix, detector configuration, and measurement conditions.
Yes. Automated microXRF mapping can analyze large areas or complete components, allowing researchers to evaluate elemental uniformity across electrodes, catalyst layers, solar cells, and material coupons rather than relying only on isolated point measurements.
Yes. MicroXRF can reveal unexpected elements, localized contamination, catalyst redistribution, transition-metal migration, coating variation, and other spatial chemical changes. Determining the underlying degradation mechanism may require comparison with unused samples and complementary structural, electrochemical, or surface-analysis methods.
No. Lithium produces X-rays that are too low in energy for conventional XRF detection. MicroXRF can instead map the transition metals, dopants, current-collector materials, coatings, sulfur, phosphorus, and contaminants associated with lithium-based energy materials.
Not always. Many energy materials can be analyzed in air, while vacuum or helium can improve sensitivity to lower-energy X-rays from lighter elements. The best environment depends on the elements of interest, sample geometry, and whether the material is compatible with vacuum conditions.
Yes. MicroXRF can analyze the composition and thickness of multilayer coatings and thin-film structures when the materials and layer geometry are suitable for XRF analysis. Quantitative thin-film methods can be used to evaluate multiple layers and an underlying substrate without physically sectioning the device.