Semiconductors & Microelectronics
Broad-area screening to targeted elemental insight — from wafers and dies to packages, boards, and trace samples.
Atlas microXRF non-destructively maps wafers, dies, packages, boards, and trace samples, distinguishing process materials and contaminants through spatially resolved elemental analysis. It combines large-area surveys with targeted sub-maps and line scans in one workflow, supporting failure analysis, process monitoring, contamination control, and incoming inspection.
With ultra-high spatial resolution and broad elemental coverage (C to U), Atlas is suited for verifying gallium nitride wafers, silicon carbide, and other compound semiconductor materials — connecting wafer-scale screening with targeted follow-up so teams can locate issues quickly without destroying valuable samples.
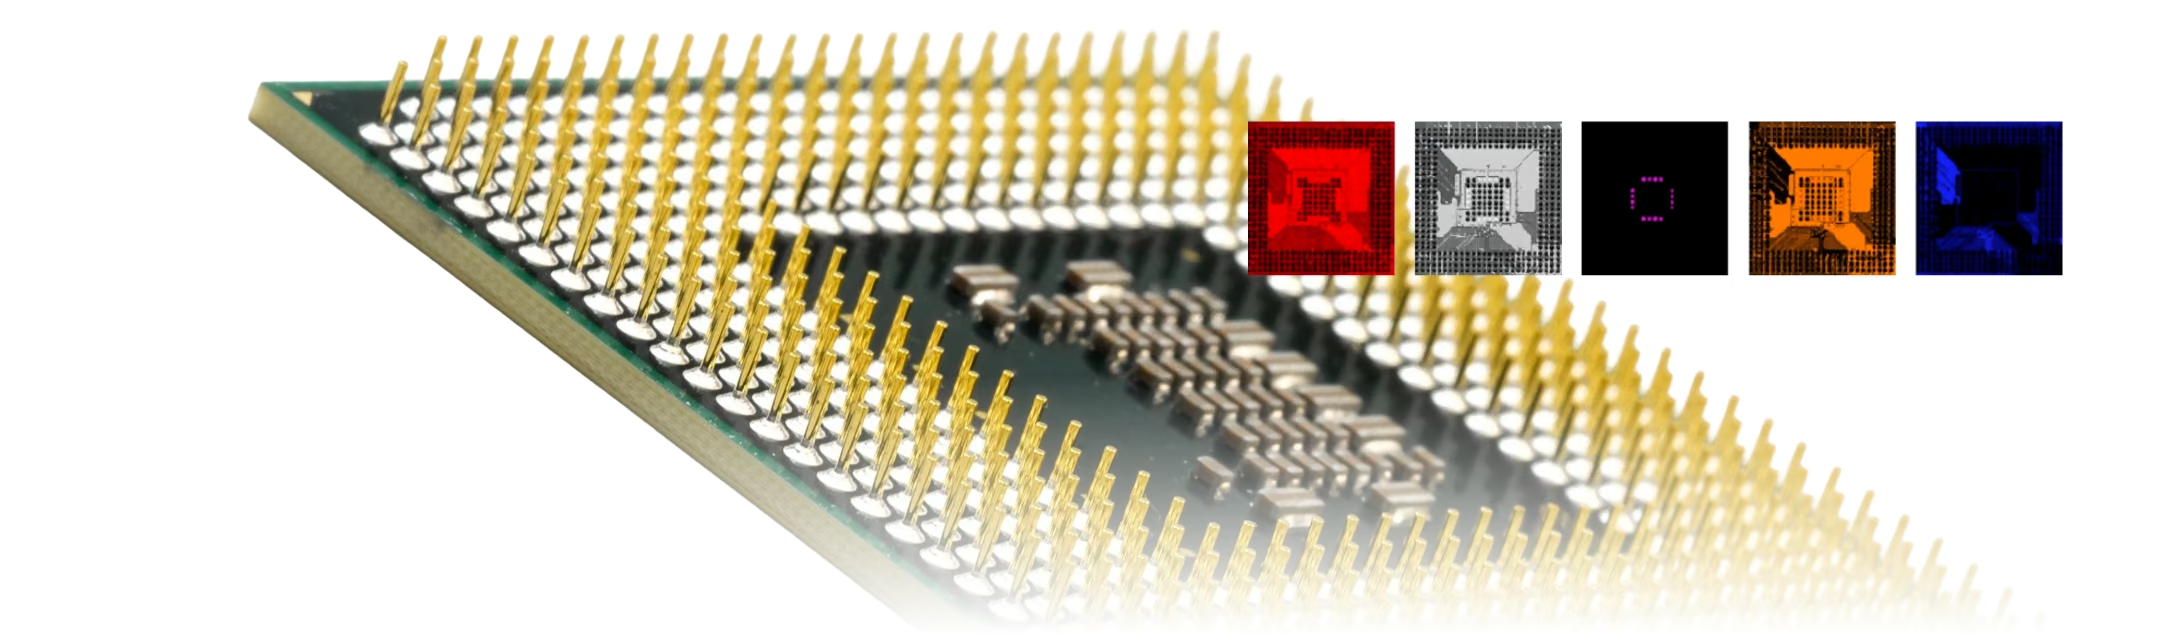
Elemental Insight From Assembly to Defect
Three stages of the same workflow, on one platform — no switching instruments between them.
1
Screen Complete Assemblies
Map material composition and elemental variation across boards, components, traces, and complex assemblies.
2
Localize Microscopic Defects
Find contamination, residues, or anomalous features, then target them with high-resolution sub-maps.
3
Verify Materials & Processes
Evaluate metallization, coatings, layer behavior, and process variation non-destructively.
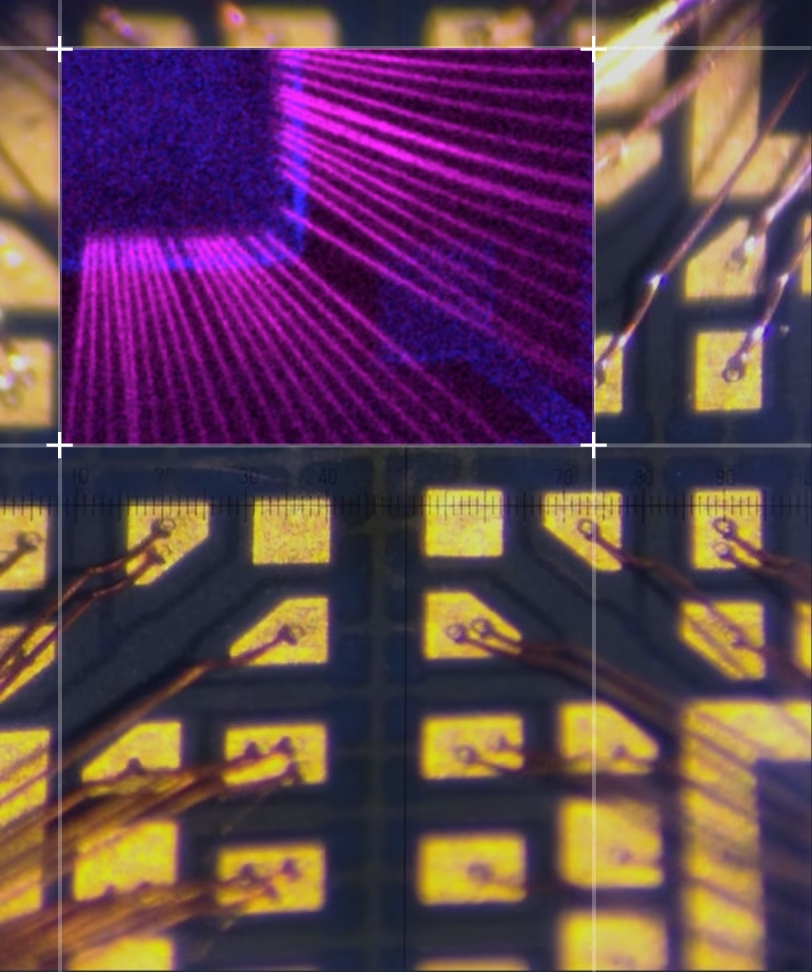
High-Resolution Analysis of Interconnects and Contamination
5 µm mapping resolving individual wire bonds and packaging residues on a real quad flat package.
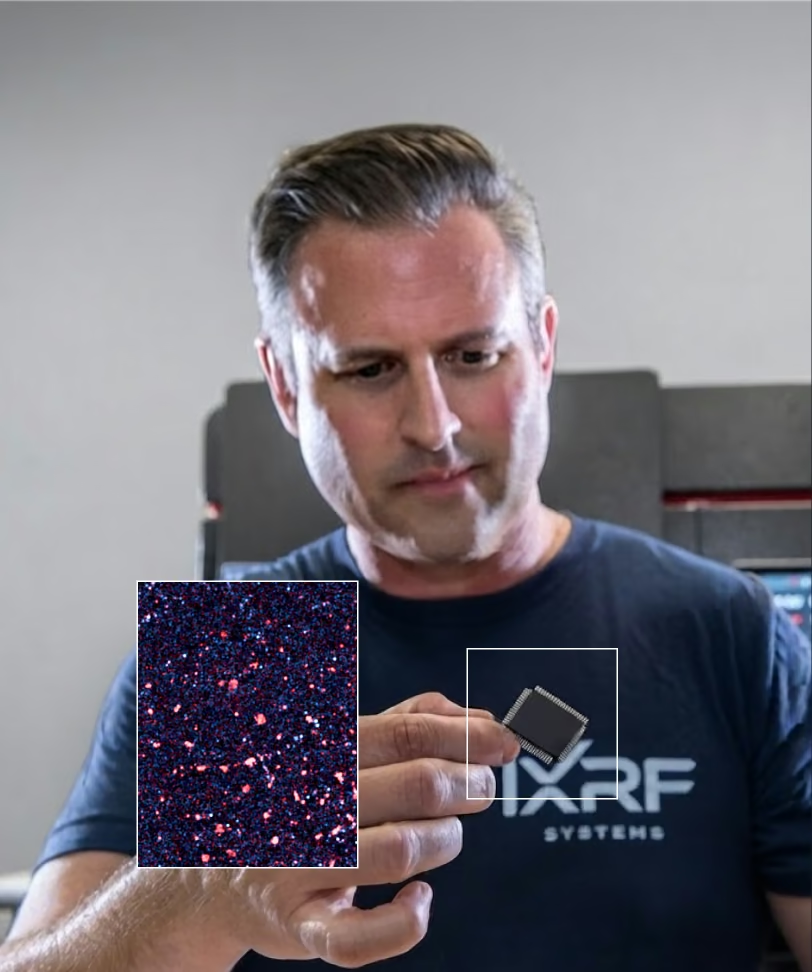
Real Contamination Map
K/Ca overlay on the same package — scattered particle-like residues visible against the substrate, exactly the kind of localized packaging contamination a bulk measurement can't isolate.
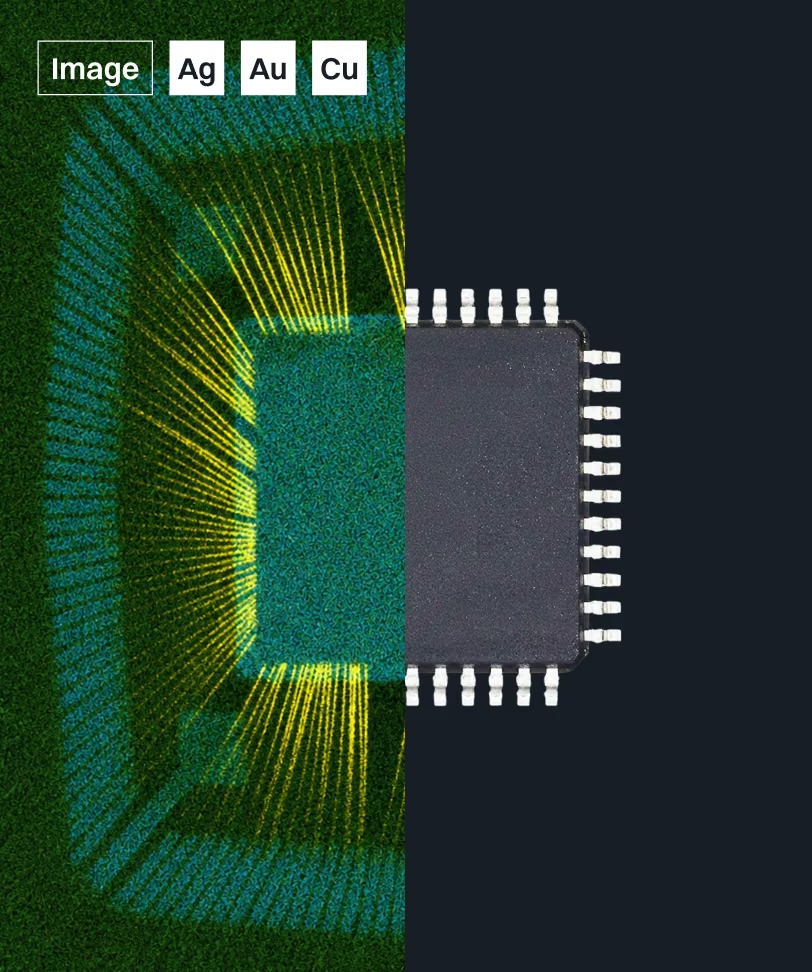
QFP Package Under Test
The real quad flat package these maps were collected from — for reference alongside the elemental overlays above.
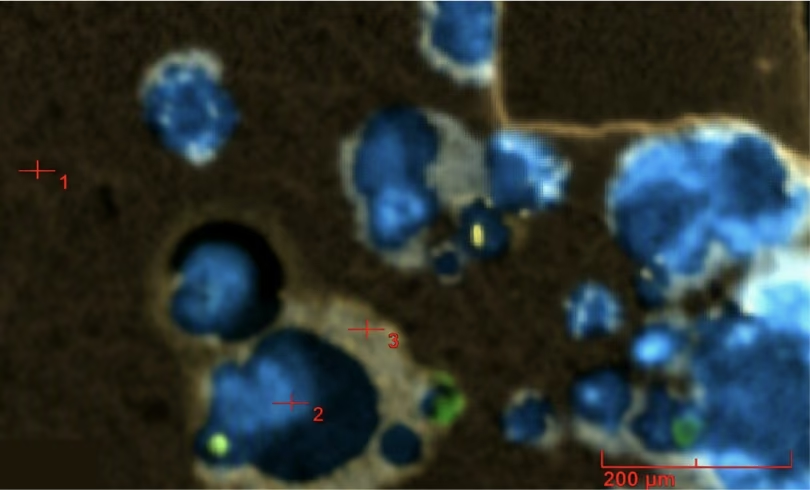
5 µm Sub-Mapping Resolves Contamination Missed by Bulk Measurements
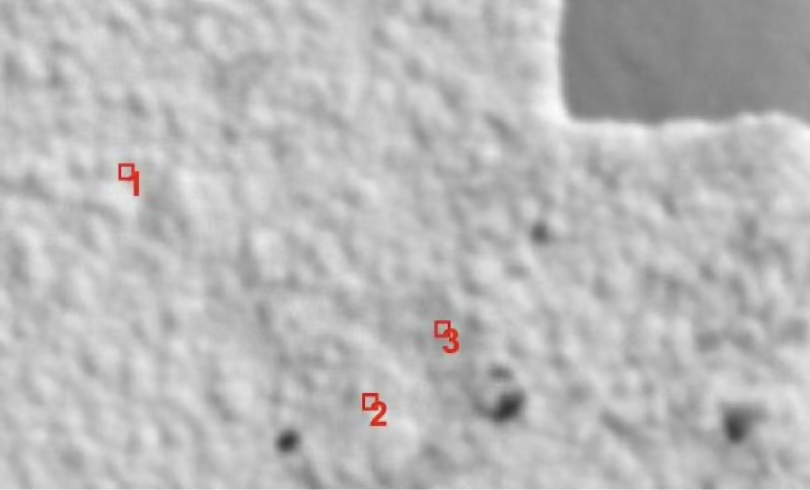
Three real, quantified solder-related contamination sites from an actual sub-map overlay. Three localized features show measurable Sn and Pb together with Au, consistent with solder-related contamination or residue — invisible to a bulk-composition measurement.
| Location | Fe | Ni | Cu | Sn | Au | Pb |
|---|---|---|---|---|---|---|
| 1 | 0.05 | 74.40 | 20.92 | 0.24 | 4.31 | 0.91 |
| 2 | 0.03 | 67.10 | 20.89 | 8.00 | 1.86 | 2.12 |
| 3 | 0.05 | 65.14 | 21.27 | 4.38 | 6.62 | 2.54 |
Composition Comparison Across Many Locations
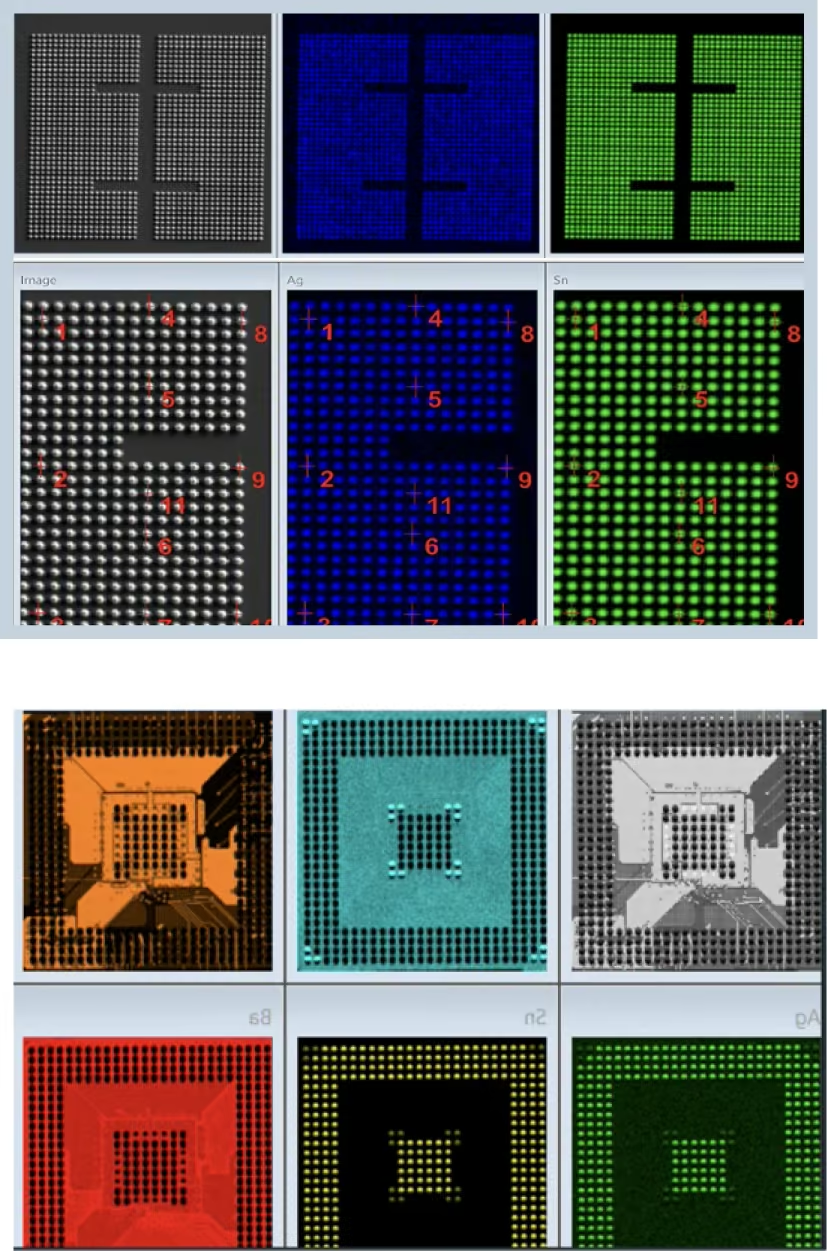
Ten real bump measurements from one wafer, with automatically calculated statistics. Map-based quantification compares bump composition across many locations on the same sample — a full X-ray spectrum is captured at each point, and ‘Go To’ stage navigation returns users to specific features for follow-up work.
| Sample | Ag (wt%) | Sn (wt%) |
|---|---|---|
| Center-1 | 1.4 | 98.6 |
| Center-2 | 1.3 | 98.7 |
| Center-3 | 1.5 | 98.5 |
| Center-4 | 1.3 | 98.7 |
| Center-5 | 2.0 | 98.0 |
| Center-6 | 1.6 | 98.5 |
| Center-7 | 1.3 | 98.8 |
| Center-8 | 1.5 | 98.5 |
| Center-9 | 1.3 | 98.7 |
| Center-10 | 1.6 | 98.4 |
| Mean | 1.5 | 98.5 |
| Std. Dev. | 0.2 | 0.2 |
| Min / Max | 1.3 / 2.0 | 98.0 / 98.7 |
Multi-Layer Thin Film Analysis
Non-Destructive Thickness and Composition Measurement
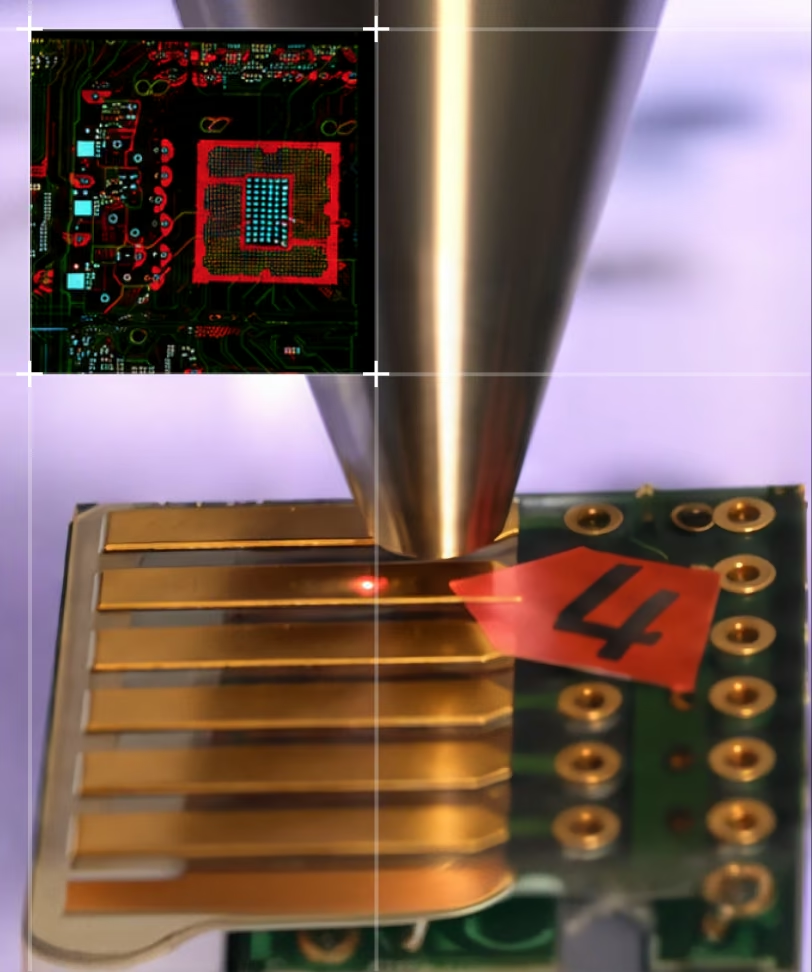
Up to 8 layers plus infinite substrate, modeled without cross-sectioning the part.
- Measures large components while targeting microscopic regions with up to 5 µm spatial resolution
- Supports up to 8 layers plus infinite substrate using Fundamental Parameters modeling
- Reveals thickness variation across plated parts
Wafer & Die Mapping
Screen Uniformity, Reveal Elemental Variation
Wafer-scale surveys followed immediately by targeted sub-maps, in one workflow.
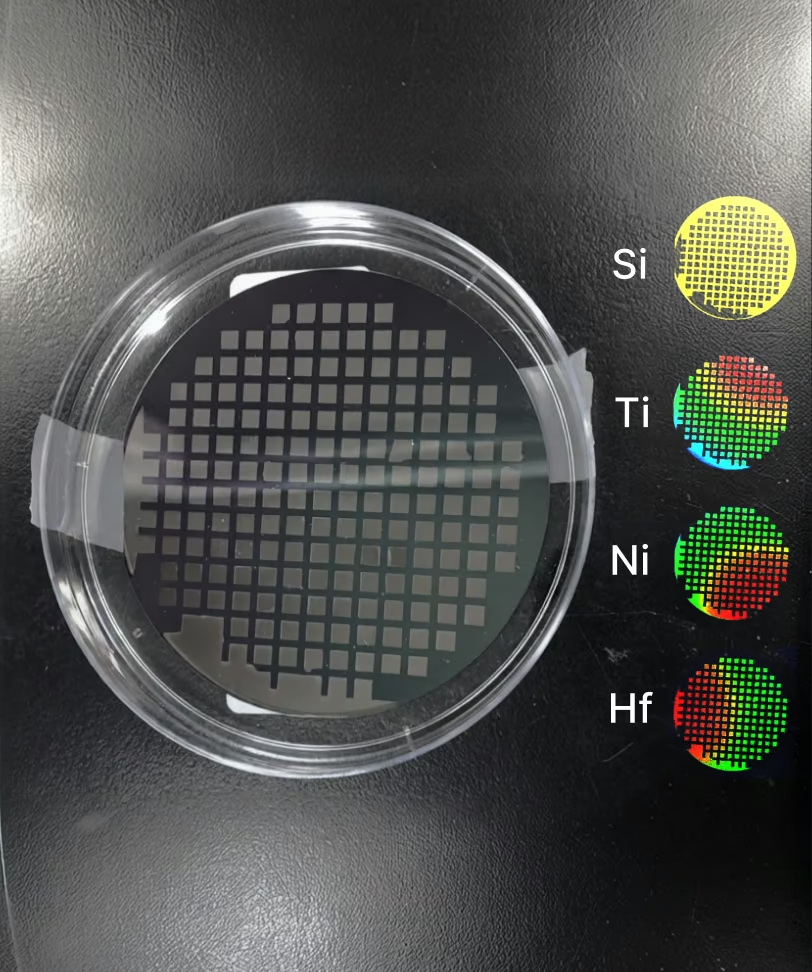
Wafer-scale maps quickly highlight non-uniformity, missing or altered dies, and spatial trends. Elemental overlays separate Si, Cu, Ta, Ni, and other process materials across patterned structures. Thermal-scale maps reveal gradients that may not be obvious in optical images alone — large-area maps can be followed immediately by sub-maps on selected regions of interest.
Once an elemental map is generated, users can define regions of interest to create higher-resolution sub-maps for targeted analysis — isolating localized contamination, trace residues, and subtle element differences. A sub-region of a sub-map can be re-mapped when even more detail is needed.
Circuit Boards, Lead Frames, and Wafer Metrology
Four established real use cases, each with its own specific analytical questions.
Circuit Board Inspection
- Fast X-ray mapping for electronics inspections
- A complete X-ray spectrum for each pixel in the map
- Measure thin gold and palladium coatings on PCBs
- Measure coating thickness of Cu, Ni, etc.
- Measure solder composition
- RoHS / WEEE compliance
Lead Frame Imaging
- Measurements on very small flat components — conducting paths, contacts, lead frames
- Multi-coating systems (e.g., AuAg/Pd/Ni/CuFe) in the nanometer range
- Determination of phosphorus content in NiP coatings
- Functional coatings in electronics and semiconductor industries
Wafer Metrology
- Sn/Ag bump and pillar measurements
- Light-element detection
- Metal film stack composition, such as CIGS
- Cu CMP control at BEOL
Wafer Metrology (continued)
- Multi-stack structures
- Sputtering targets
- Thermal barrier coating
- Thickness and composition control
MicroXRF Compared With Other Semiconductor-Analysis Methods
MicroXRF's advantage is coverage and non-destructive workflow, not finer resolution than SEM.
vs. SEM-EDS
SEM-EDS resolves finer features and combines elemental data with detailed imaging, but typically requires a smaller, prepared, conductive-coated sample inside the chamber. MicroXRF covers full boards, wafers, and packages non-destructively — often used to screen broadly before a targeted SEM-EDS follow-up on a flagged region.
vs. Cross-Sectioning
Physical cross-sectioning destroys the part to reveal layer structure. MicroXRF's Fundamental Parameters modeling quantifies multilayer thickness and composition non-destructively — the part can still be used, shipped, or re-measured after analysis.
See What MicroXRF Can Find in Your Assembly
Describe your board, wafer, package, or component type and the elemental question you're trying to answer. An IXRF applications scientist can help determine whether microXRF is the right fit and discuss sample feasibility before instrument selection.
Frequently
Asked Questions
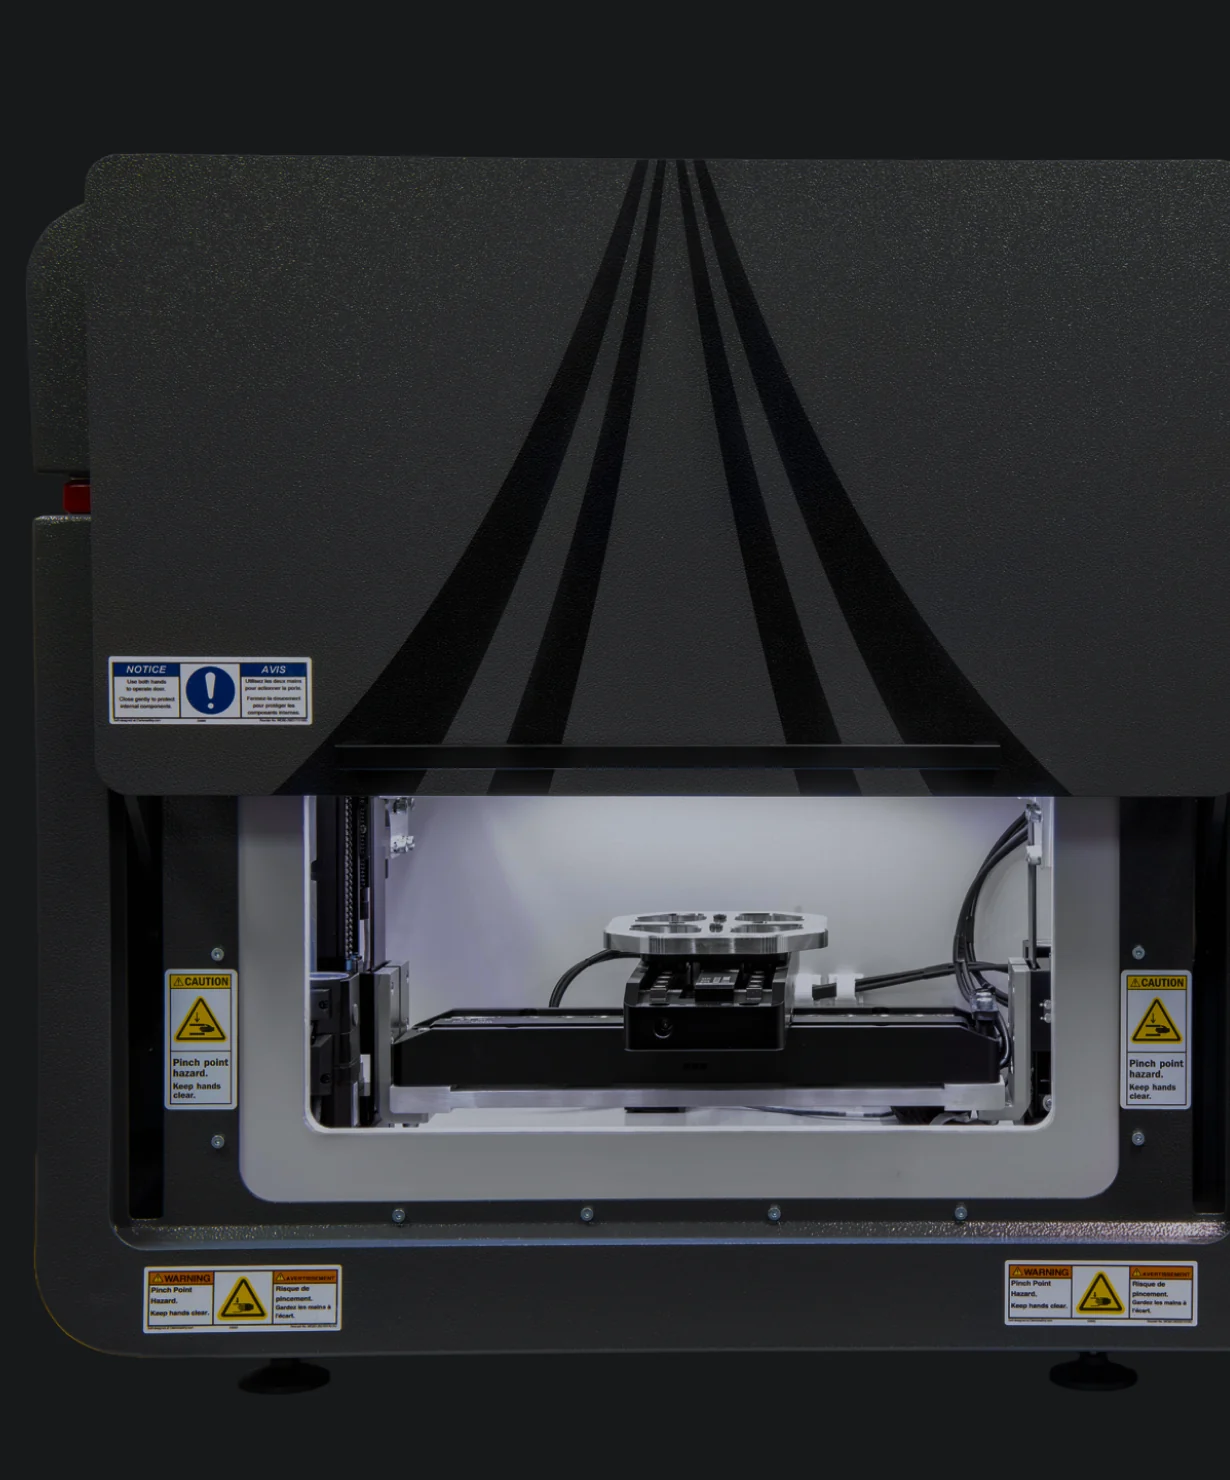
Atlas Apex can analyze wafers, wafer sections, substrates, and other planar microelectronic samples. Atlas Apex M provides automated mapping over areas up to approximately 220 × 200 mm, while Atlas Apex X provides greater flexibility for larger wafers, assemblies, and samples that exceed the chamber-based system’s practical dimensions.
Yes. MicroXRF can non-destructively measure the composition and thickness of multilayer coatings and thin films when the layer materials and structure are suitable for XRF analysis. Iridium Ultra supports thin-film Fundamental Parameters analysis for structures containing up to eight layers plus a substrate.
Yes. Atlas Apex can create high-resolution elemental maps of interconnects, wire bonds, solder features, metallization, contacts, and other microelectronic structures. Focused X-ray spot sizes down to approximately 5 µm are available, although actual spatial resolution depends on the elements, materials, and sample geometry being analyzed.
Yes. MicroXRF can map elemental distributions across wafers, coatings, and deposited films to identify composition gradients, non-uniform deposition, localized enrichment, contamination, and process-related variation. Each Atlas Apex mapping pixel retains a complete X-ray spectrum for subsequent analysis.
Yes. Atlas Apex can automate measurements across multiple solder bumps, pads, contacts, or other predefined locations and compare their elemental composition. Automated positioning and mapping make it possible to identify lot-to-lot, device-to-device, or location-to-location compositional variation efficiently.
Yes. MicroXRF is highly effective for locating and identifying many forms of metallic contamination, foreign material, plating anomalies, elemental inclusions, and compositional defects. Elemental mapping can show both the chemistry and spatial distribution of anomalous material without requiring destructive sectioning in many applications.
Yes. Because X-rays penetrate more deeply than the electron beam used in SEM-EDS, Atlas Apex can often analyze packaged components, circuit boards, connectors, solder joints, and electronic assemblies without cross-sectioning. The accessible depth depends on the materials, layer thicknesses, elements of interest, and device geometry.
Yes. MicroXRF can rapidly screen electronic materials for elements associated with RoHS restrictions, including lead, mercury, cadmium, chromium, and bromine. XRF measures elemental composition, however, so additional analytical techniques may be required when regulations depend on chemical form or molecular species, such as hexavalent chromium or specific brominated flame retardants.
MicroXRF and SEM-EDS provide complementary information. SEM-EDS offers much higher spatial resolution for very small features, while MicroXRF provides larger-area mapping, greater X-ray penetration, strong trace-element sensitivity, and analysis of larger samples with minimal preparation. MicroXRF can therefore locate compositional anomalies over a broad area before SEM-EDS is used for detailed investigation.
Atlas Apex can analyze a wide range of semiconductor and electronic materials, including silicon wafers, metallization layers, solder alloys, wire bonds, contacts, interconnects, lead frames, coatings, ceramic substrates, printed circuit boards, electronic components, and packaged devices. Applications range from R&D and process development to quality control and failure analysis.