Critical
Minerals Analysis
Mineral-scale elemental insight for natural and engineered materials — supporting USGS critical mineral programs without damaging valuable samples.
Atlas Apex microXRF delivers high-resolution, non-destructive elemental mapping for critical minerals and mining applications. With ≤10 µm spatial resolution, enhanced light-element sensitivity, and high-throughput multi-SDD detection, Atlas Apex connects bulk chemistry, mineralogy, and material performance — supporting resource evaluation, industrial processing optimization, and quality control.
Bulk techniques such as XRF, ICP, and wet chemistry quantify elemental totals, but often remove spatial, textural, and phase context. MicroXRF preserves that context, enabling direct visualization of elemental distributions across minerals, grains, inclusions, alteration fronts, and reaction zones.
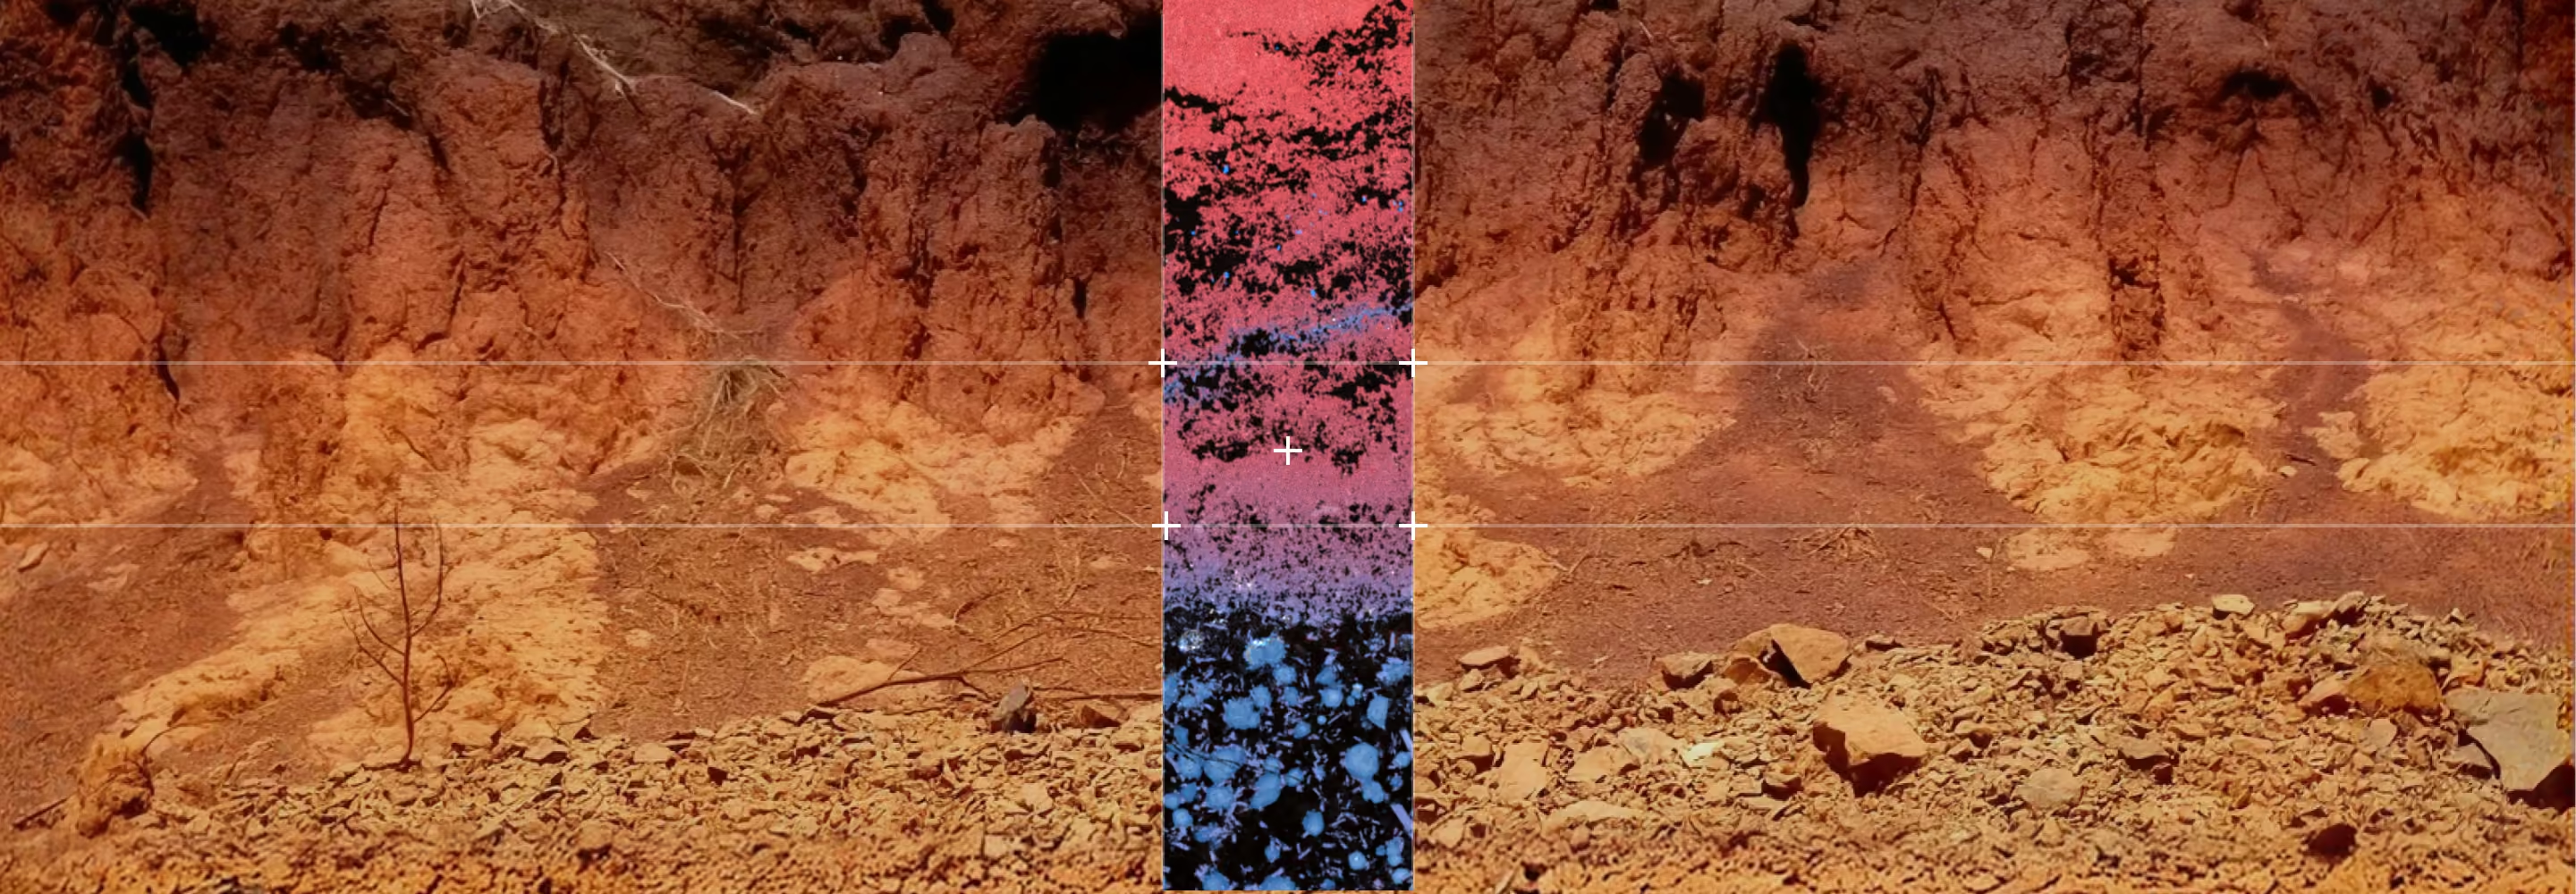
Built for Complex, Heterogeneous Materials
Atlas Apex supports mineral-scale analysis across:
- USGS critical mineral systems (Ni, Cr, Co, REEs, P, Ti, PGEs)
- Ultramafic and layered mafic intrusions
- Porphyry, epithermal, and skarn systems
- Metasomatic carbonate–silicate contacts
- Mine tailings and beneficiation products

Geological samples are rarely uniform. Atlas Apex microXRF is engineered to handle multi-phase, high-density, and chemically complex materials while maintaining quantitative accuracy and mapping efficiency.
- ≤10 µm circular excitation spot for distortion-free mineral and phase mapping
- Multi-SDD detector architecture (up to 4) for enhanced trace-element sensitivity
- Large sample chamber supporting thin sections, polished mounts, drill chips, hand samples, slabs, and cores
- Non-destructive analysis preserving irreplaceable or process-critical materials
- Light-element performance under vacuum (C, O, Na, Mg, Al, Si)
- Mineral and phase recognition using reference databases, with QUANTMAP pixel quantification
Proven in Exploration, Research, and Processing
Brucejack Deposit, British Columbia
Bonanza-Grade Gold Deportment
MicroXRF mapping of bonanza-grade gold mineralization (>100 g/t Au) shows the spatial distribution of Au and associated pathfinder elements (Ag, Pb, Zn), enabling evaluation of gold deportment as free gold, micro-inclusions, or electrum associated with sulfides — supporting exploration, sampling, and processing optimization.
Red Hills Porphyry System, Philipsburg District, Montana
Hydrothermal Alteration Mapping
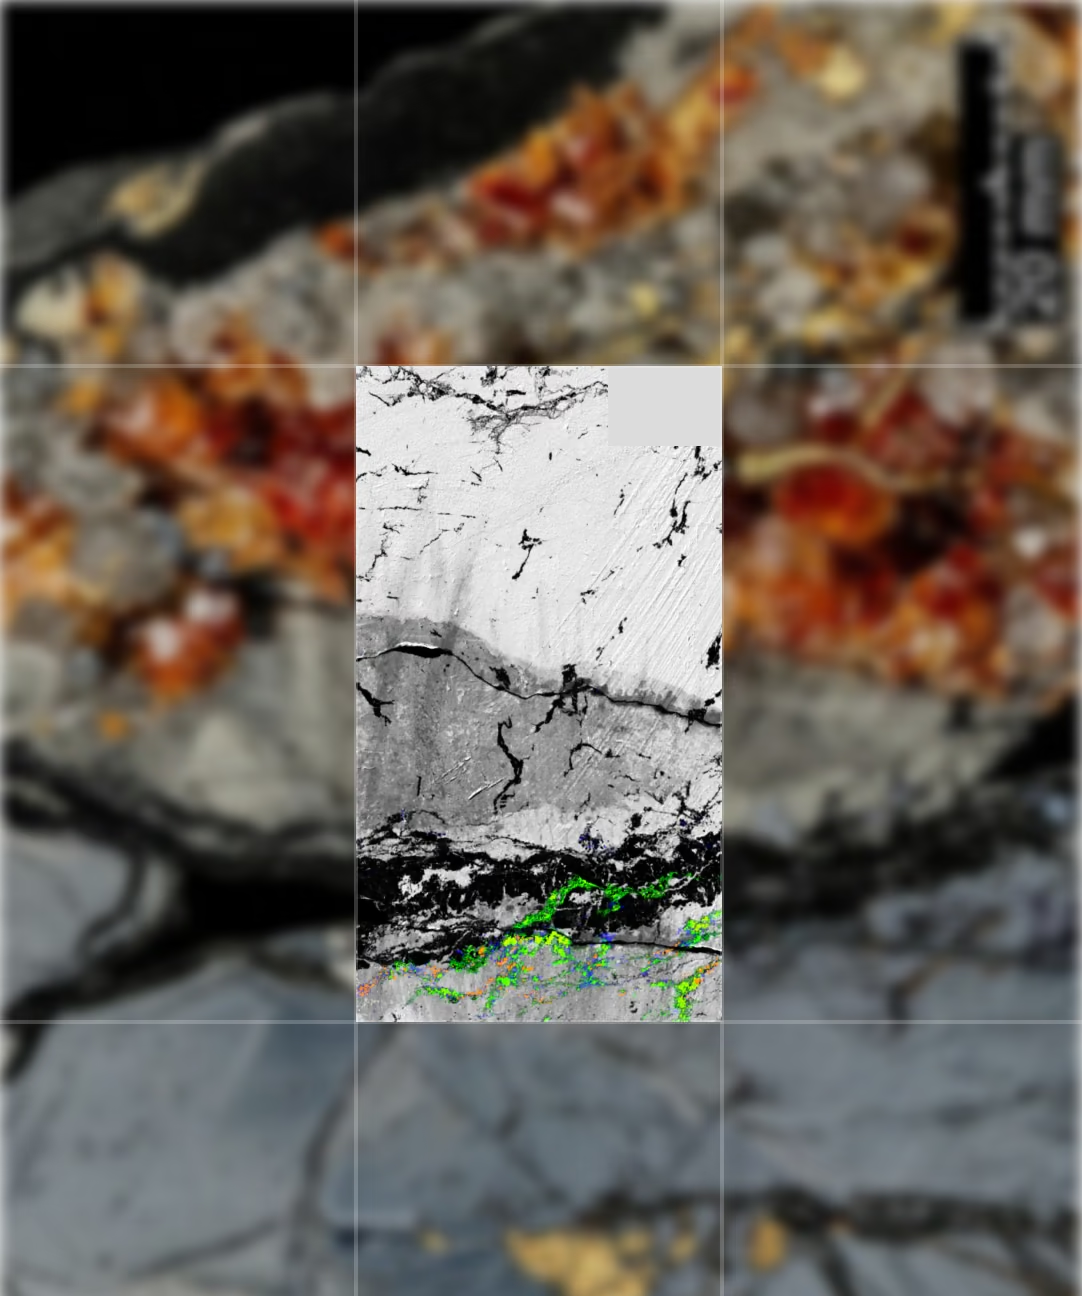
Elemental maps highlight wormy quartz veins formed from volatile-rich magmatic fluids. K/Al ratio variations distinguish primary K-feldspar from hydrothermal muscovite, providing mineral-scale evidence for alteration processes associated with porphyry-style ore formation.
UBC Sample
Distinguishing Monazite from Apatite and Xenotime
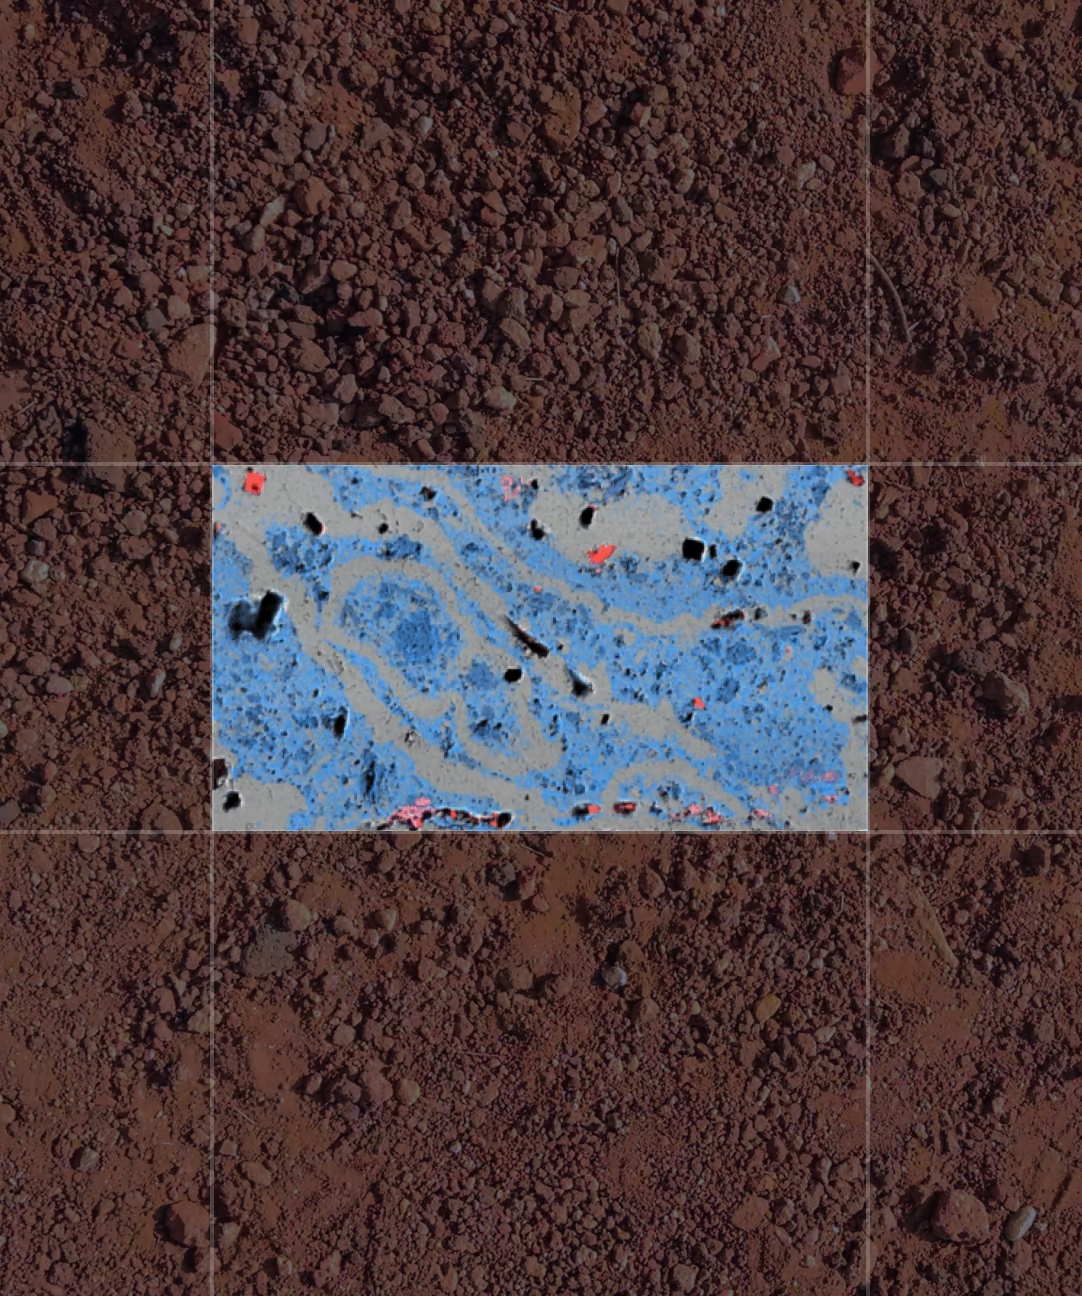
Elemental correlations identify monazite as the primary LREE repository, enriched in Ce and La and accommodating U and Th — key for geochronology via radiogenic Pb. Apatite (Ca-rich) and xenotime (Y-rich) are differentiated by their distinct elemental signatures.
Stillwater Complex, Montana
Chromium-Bearing Domain Mapping
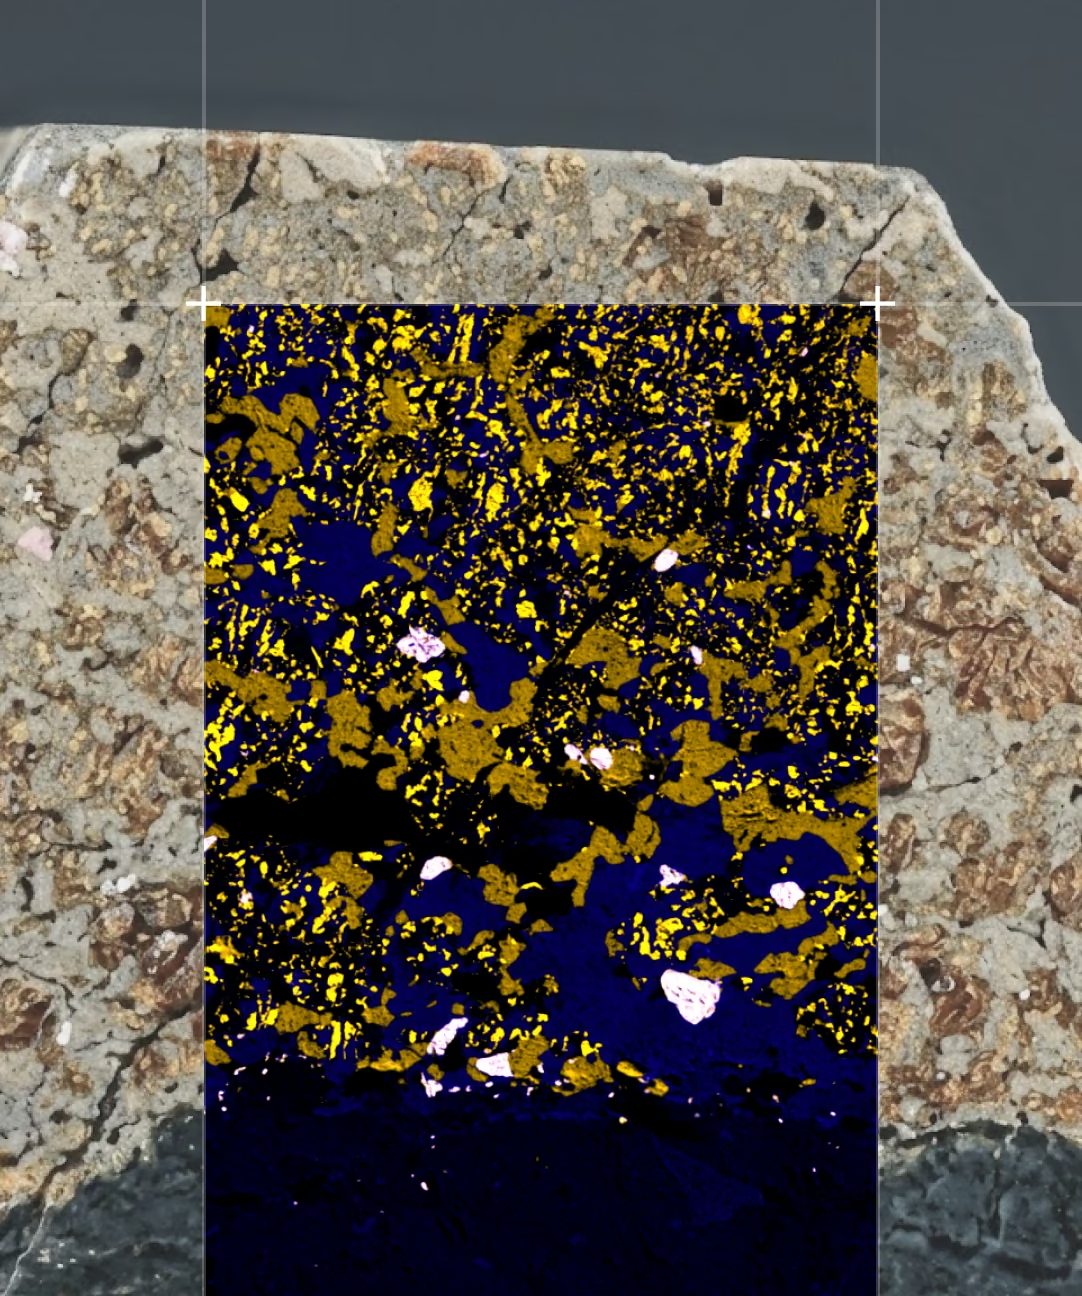
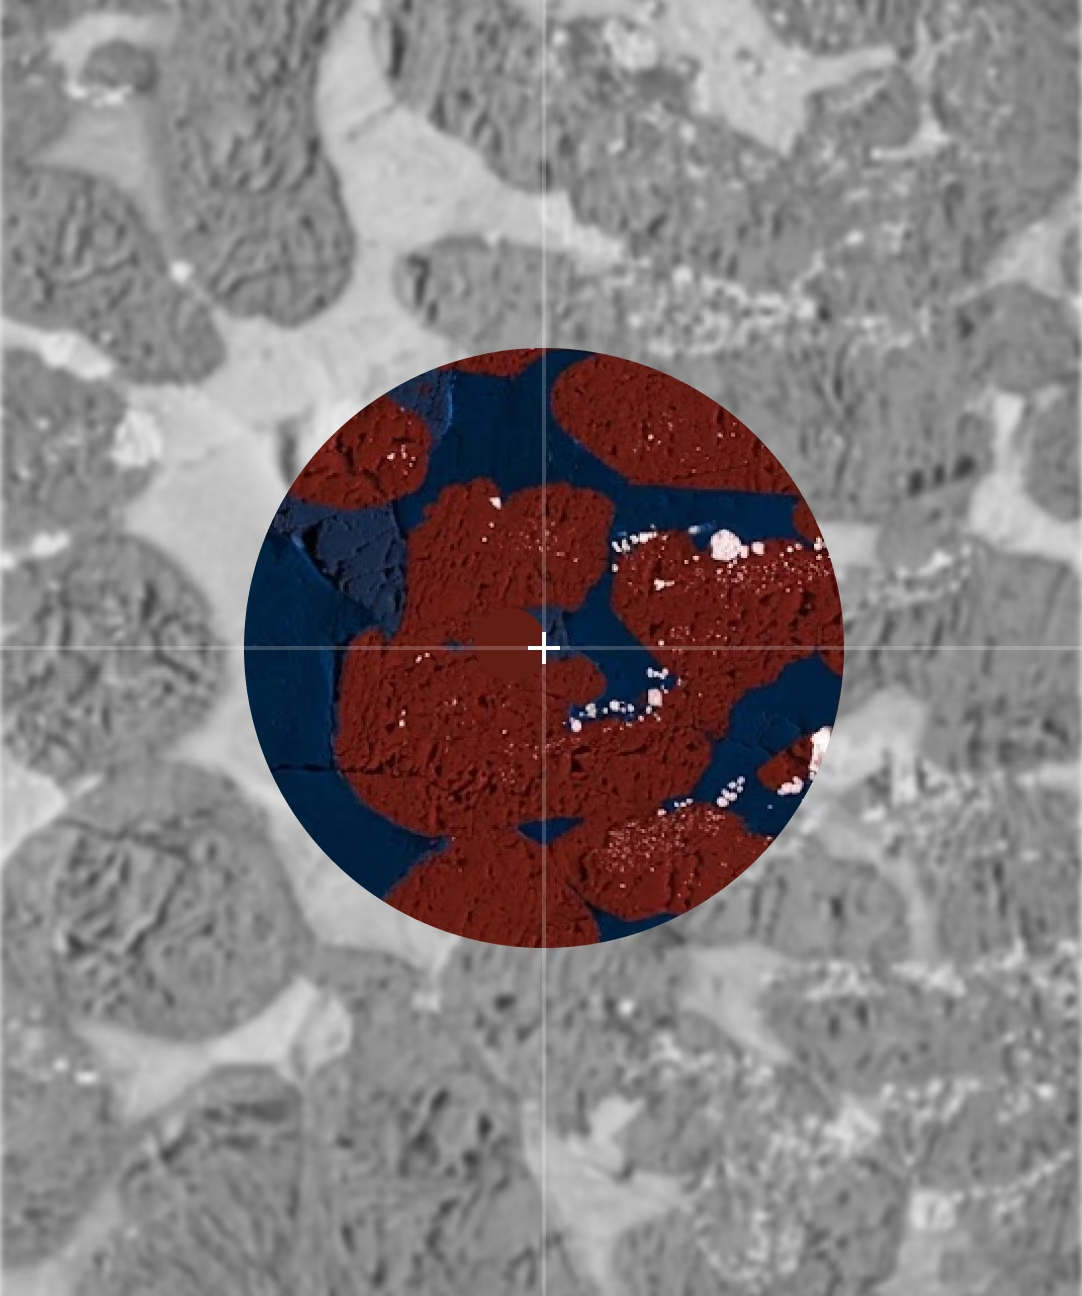
Spatial distribution of Cr relative to Fe and Ca within a large slab from the largest domestic source of chromium in the United States — highlighting chromite-rich domains and their textural relationships, relevant to renewed exploration interest.
Ledmore Syenite–Marble Contact, Northwest Scotland
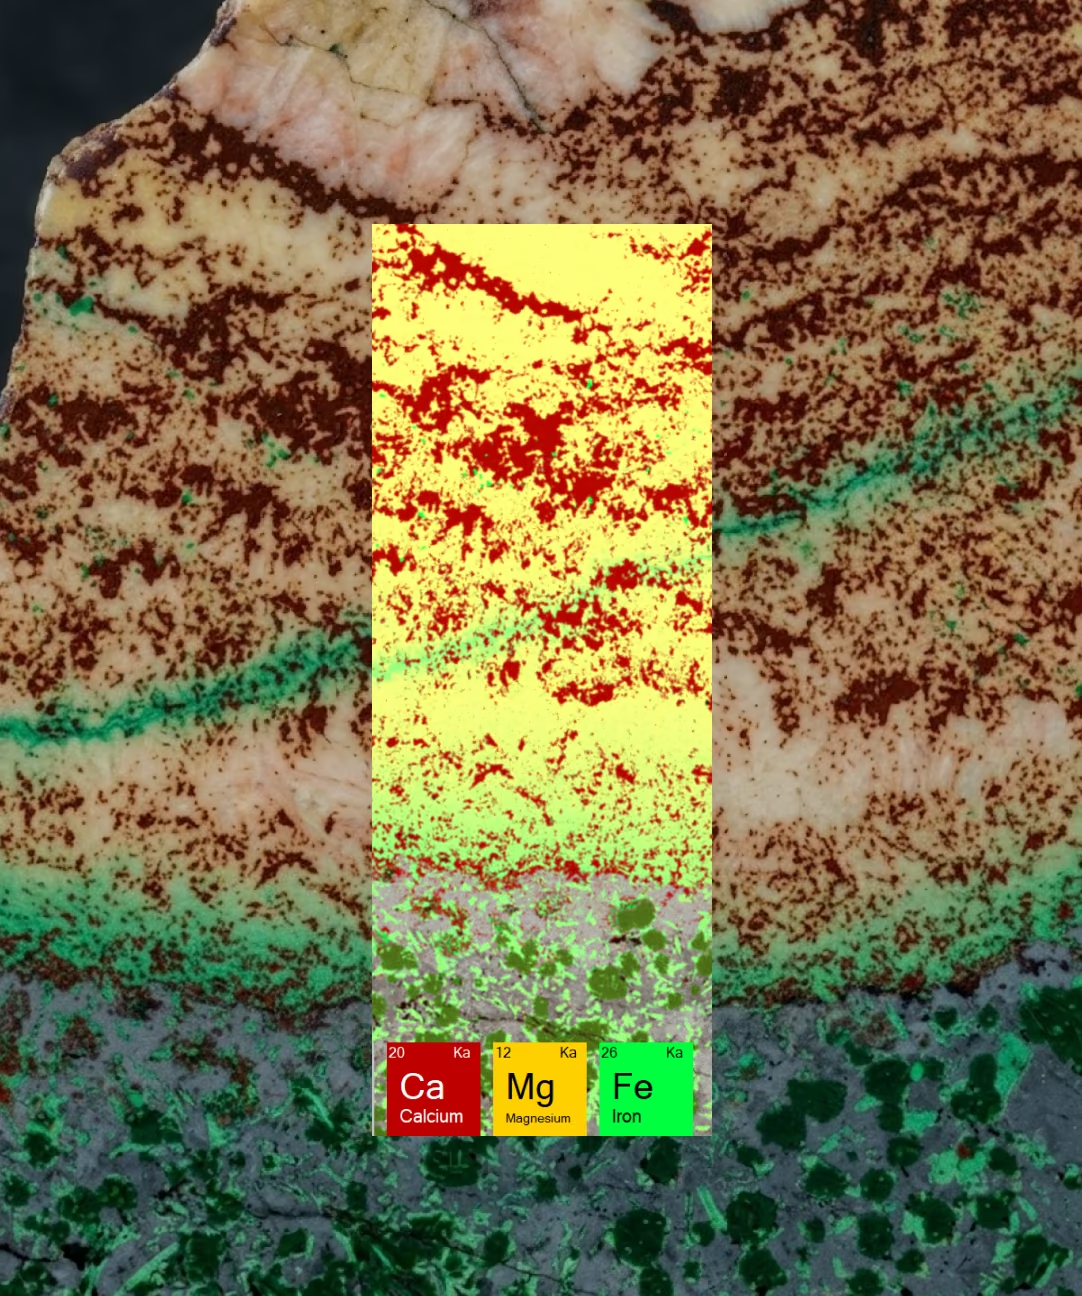
Fe–Mg Metasomatism and REE Transport
Mapping across the syenite–marble contact shows Fe–Mg metasomatism from an Fe- and K-rich syenite intruding Ca–Mg-rich marble. Trace REE enrichments localized at the transition indicate fluid-assisted transport, constraining cation-transport length scales.
Typical MicroXRF Workflow for Geological Samples
- 01.
Mount sample (thin section, chip, slab, polished block, or core)
- 02.
Acquire optical overview image
- 03.
Run fast survey map (~20 minutes)
- 04.
Select regions of interest
- 05.
Perform high-resolution mapping (5–10 µm)
- 06.
Apply mineral/phase classification and QUANTMAP
- 07.
Export results for petrography, metallurgy, GIS, or QA/QC reporting
Iridium Ultra Tools for Critical Minerals
Automated reporting supports publications and quality documentation. Global support includes local installation and training, multi-region demo availability, geological calibration standards, and fast shipment from the United States.
IU-MAP_ACQUIRE
High-speed elemental mapping
IU-QUANTMAP
Quantitative pixel chemistry
IU-GEOCHEM
Mineral identification against a ~4,000-composition library
Get a MicroXRF Demonstration
Whether your focus is critical minerals, mining, industrial materials, or QA/QC, Atlas Apex delivers mineral-scale insight for confident decisions.

Frequently
Asked Questions
Atlas Apex can detect and map a wide range of critical elements, including rare earth elements, niobium, tantalum, cobalt, nickel, manganese, chromium, titanium, vanadium, tungsten, tin, and others, depending on concentration, matrix, and analytical conditions. Elemental maps reveal where these elements occur and how they are spatially associated within the sample.
Yes. MicroXRF can distinguish many REE-rich domains based on their elemental chemistry and spatial associations. For example, differences in REE, phosphorus, yttrium, thorium, and other elements can help identify candidate phases such as monazite and xenotime, although complementary mineralogical techniques may be required for definitive phase identification.
No. Lithium produces X-rays that are too low in energy for conventional XRF detection. However, Atlas Apex can map elements associated with lithium-bearing minerals and alteration zones, helping researchers identify areas of interest for follow-up analysis using complementary techniques.
A bulk assay provides an average elemental concentration for the entire analyzed sample, while microXRF shows where elements occur within the sample. This spatial information can reveal mineralization, zoning, veins, alteration, inclusions, and localized enrichment that may be obscured in a bulk measurement.
Atlas Apex can analyze a wide range of geological materials, including rock slabs, drill core, thin sections, polished sections, powders, mineral grains, concentrates, sediments, and exploration samples. Many samples can be analyzed with little or no preparation.
Yes. Atlas Apex can perform elemental mapping on drill core sections, rock slabs, polished mounts, and standard geological thin sections. This allows researchers to examine elemental distributions over large areas and then target specific features for higher-resolution investigation.
Yes. MicroXRF is generally a non-destructive analytical technique because it uses X-rays to measure elemental composition without consuming the sample. This makes it especially useful for valuable, limited, or archival geological specimens.
Yes. Atlas Apex supports both qualitative elemental mapping and quantitative XRF analysis. Iridium Ultra can calculate elemental concentrations using appropriate analytical methods, standards, or Fundamental Parameters approaches, although achievable accuracy depends on the element, concentration, sample matrix, and preparation.
Yes. Elemental maps can show where critical elements are concentrated and which other elements occur with them, helping researchers investigate mineral associations, host phases, zoning, alteration, and potential deportment pathways. MicroXRF chemistry can guide phase interpretation and selection of areas for complementary mineralogical analysis.
MicroXRF provides rapid, non-destructive elemental mapping across comparatively large sample areas, making it useful for locating features before more targeted analysis. SEM-EDS provides higher spatial resolution, XRD identifies crystalline phases, and LA-ICP-MS provides highly sensitive trace-element and isotopic measurements. Used together, these techniques provide complementary spatial, chemical, and mineralogical information.
MicroXRF can map REEs and associated elements across rocks, drill core, and thin sections to reveal REE-rich grains, alteration zones, veins, and geochemical relationships. Mapping elements such as La, Ce, Nd, Y, P, Nb, Th, Ca, and Fe can help identify candidate REE-bearing phases and areas for targeted follow-up analysis.