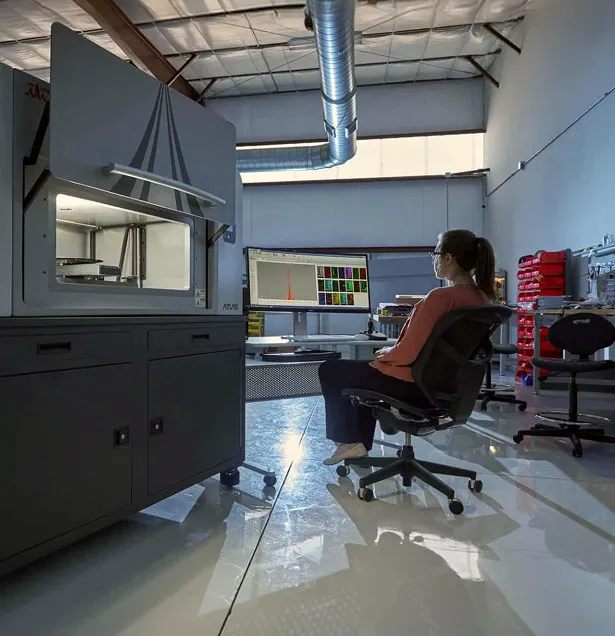
Turning MicroXRF Data Into Useful Information
Collecting an XRF spectrum is only the beginning.
Modern microXRF experiments can generate thousands or millions of individual spectra across a sample. Software is therefore essential for converting that large dataset into elemental maps, spectra, quantitative information, and interpretable analytical results.
Understanding how microXRF data are processed can help users distinguish genuine chemical features from artifacts and extract more value from every measurement.
Understanding the XRF Spectrum
An XRF spectrum displays detected X-ray intensity as a function of energy.
Peaks correspond to characteristic X-ray emission lines associated with elements in the sample.
Interpreting a spectrum requires consideration of:
- Peak position
- Peak intensity
- Background
- Overlapping emission lines
- Detector response
- Escape peaks
- Sum peaks
- Excitation conditions
Software can assist with element identification, but analytical judgment remains important when peaks overlap or signals occur close to detection limits.
Reading Elemental Maps
An elemental map converts XRF intensity into spatial information.
Each pixel represents a location on the sample, allowing researchers to visualize where selected elements are concentrated.
Maps can reveal:
- Elemental zoning
- Mineral associations
- Inclusions
- Coatings
- Contamination
- Reaction fronts
- Corrosion
- Segregation
- Concentration gradients
- Manufacturing defects
The strongest analytical insight often comes not from examining one elemental map in isolation, but from comparing how multiple elements occur together.
Qualitative Analysis
Qualitative microXRF asks a fundamental question: Which elements are present?
This can be extremely valuable for identifying unknown materials, screening samples, locating regions of interest, and determining which elements should be investigated in more detail.
Qualitative maps can also rapidly reveal compositional differences that are difficult or impossible to see optically.
Quantitative Analysis
Quantitative XRF attempts to determine elemental concentration rather than simply relative intensity.
Quantification can require consideration of:
- Matrix effects
- Absorption
- Secondary fluorescence
- Sample thickness
- Surface geometry
- Standards
- Fundamental parameters
- Calibration strategy
Quantitative analysis is therefore a different analytical task from generating visually informative elemental maps.
Users should determine in advance whether the objective is elemental localization, relative comparison, semi-quantitative analysis, or absolute concentration.
Spectral Analysis Within Maps
One of the most powerful aspects of microXRF is the ability to connect elemental images back to the underlying spectra.
Users can select individual locations or regions within a map and evaluate the spectra associated with those areas.
This makes it possible to:
- Compare phases
- Investigate unexpected features
- Confirm element assignments
- Examine trace signals
- Identify compositional differences
- Select areas for additional analysis
Automated spectral spot analysis can further extend these workflows by collecting or processing spectra across multiple predefined locations.
Optimizing Map Acquisition
Mapping involves trade-offs.
Increasing dwell time can improve counting statistics but increases total acquisition time.
Reducing pixel spacing can provide more spatial detail but dramatically increases the number of measurement points.
Users therefore need to balance:
- Map size
- Pixel size
- Dwell time
- X-ray conditions
- Detector count rate
- Required sensitivity
- Total acquisition time
The optimal settings depend on the analytical objective.
From Data to Decisions
The ultimate value of microXRF software is not the number of maps it can generate.
It is how efficiently users can move from raw spectra to a defensible interpretation of the sample.
Explore our software and analysis resources to learn more about:
- Reading XRF spectra
- Interpreting elemental maps
- Peak identification
- Quantitative analysis
- Map optimization
- Spectral comparison
- Data processing
- Automated workflows