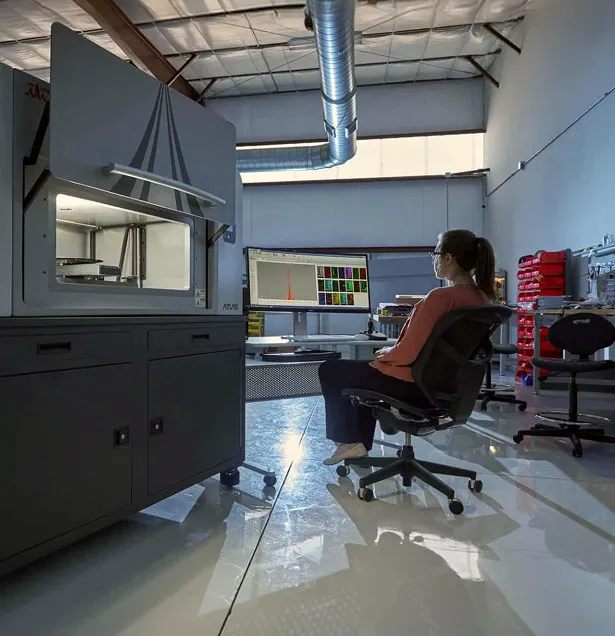
How deep do the X-rays go? It is one of the first questions people ask about microXRF, and the honest answer is: it depends. The detected signal can come from the top micrometer or from several millimeters down. This guide explains why, gives realistic numbers, and shows how to account for depth when you design measurements and read maps.
How Deep Does MicroXRF Analyze? The Short Answer
- There is no single depth. Each element, in each material, under each set of conditions, has its own information depth.
- Typical range: under 1 µm for light elements in dense metals, to around 1 cm for heavy elements in polymers.
- Two trips decide it. The incoming X-rays must reach the atom, and its fluorescence must get back out.
- There is no hard floor. Signal fades gradually, so depth is best quoted as the layer supplying 90% of the signal.
- It changes interpretation. Maps of different elements from one scan can represent different depths, and substrates can appear in the spectrum.
Penetration Depth vs. Information Depth
Penetration depth describes how far the incident beam travels into the sample. Information depth describes the layer that actually contributes to the detected signal for a given element. The second is usually much shallower, because every measurement involves two trips:
- In: incident X-rays must reach the atom with enough energy to excite it.
- Out: the atom's fluorescence must travel back through the sample to the detector.
How Information Depth Is Calculated
Both trips lose intensity exponentially (the Beer–Lambert law), so X-rays never stop at a sharp boundary. For a flat, thick, uniform sample, signal from depth z falls off as e^(−χρz), where ρ is density and χ combines both trips:
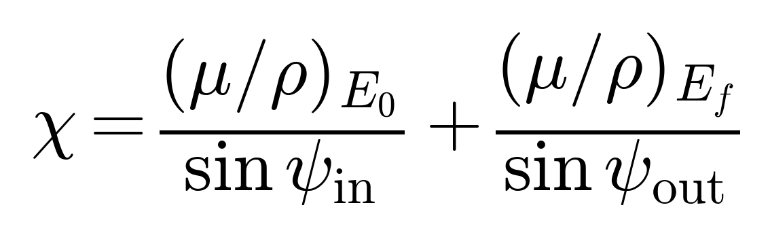
Here μ/ρ is the mass attenuation coefficient at the incident energy E₀ and the fluorescence energy Ef, and ψ are the incidence and detector take-off angles. With the orthogonal excitation of the Atlas Apex, ψin is 90°, so the incoming term needs no angle correction. Its high take-off angle keeps the outgoing path short. For light elements, that outgoing term almost always dominates.
The layer down to 2.3/(χρ) supplies 90% of the signal. This guide calls that the 90% information depth.
Key Point
How far the beam travels is not how deep the measurement sees. The detector only collects signal from where the X-rays can both get in and get back out.
What Determines MicroXRF Information Depth?
Fluorescence Energy
This is usually the deciding factor. Low-energy lines (Na, Mg, Al and Si, at 1–2 keV) are absorbed quickly and come from a thin surface layer. Higher-energy lines (Zn, Sr, Zr and Pb Lα, at roughly 9–16 keV) escape from much deeper. As a result, maps from the same scan can represent different depths. They are spatially registered but do not sample the same volume.
Excitation Energy and Tube Settings
An element emits a K line only when incident photons exceed its K absorption edge. Tube voltage, primary filters and optics reshape the excitation spectrum, and with it the effective depth. A higher voltage does not simply mean deeper analysis.
Sample Composition and Density
Light matrices such as polymers, tissue and many silicates let X-rays travel far. Dense, high-Z matrices such as steel, sulfides and lead alloys keep information shallow. The same element can have very different depths in different materials.
Absorption Edges
Attenuation jumps sharply at each element's absorption edges, so atomic number alone doesn't predict depth. In stainless steel, Ni Kα (7.48 keV) sits just above the Fe K edge (7.11 keV). Iron absorbs it strongly, making Ni information depth shallower than Cr's despite Ni's higher energy.
Measurement Geometry
X-rays that enter or leave at shallow angles travel farther to reach the same depth, so geometry sets depth too. The Atlas Apex uses orthogonal excitation: the beam enters perpendicular to the surface, taking the shortest path to any given depth. Fluorescence is collected at a high take-off angle. Grazing-incidence techniques such as TXRF take the opposite approach, deliberately confining analysis to the top nanometers.
Key Point
Information depth is not a property of the instrument alone. It belongs to the combination of element, X-ray line, sample matrix and measurement conditions.
Typical MicroXRF Information Depths by Material
Calculated 90% information depths span more than four orders of magnitude:
The same Fe Kα line reaches 4–6× deeper in quartz than in steel. In polymers, sample thickness usually becomes the limit first.
Basis: xraylib attenuation data, orthogonal (90°) excitation and a high take-off angle, a thick uniform sample, and excitation between 1.5× the absorption edge and 20 keV. Treat these values as orders of magnitude, not specifications.
Key Point
Any single depth figure for microXRF is incomplete. Always state the element, the line and the matrix it applies to.
How Sample Thickness and Layers Affect MicroXRF Results
Thin Samples and Substrate Signals
If a sample is thinner than the information depth, the beam reaches whatever is underneath. Glass slides, epoxy, filters and holders can then appear in the spectrum. A 30 µm geological thin section, for example, is thinner than the information depth for Fe or Zr in most silicates.
Thick Samples and Bulk Analysis
Once extra thickness no longer changes the signal, the sample is "infinitely thick" for that line. Deeper material still exists; it simply contributes too little to matter. Bulk analysis does not mean the full thickness is measured.
Coatings and Buried Layers
Substrate fluorescence can pass back through a coating, so both appear in the spectrum. As the coating thickens, its signal rises and the substrate's falls, which is the basis of XRF coating-thickness measurement. Whether a buried feature is detected depends on the composition of the overlying material and the buried line's energy, not on thickness alone.
Detecting an Element vs. Locating It in Depth
A copper signal from a circuit board could come from plating, a buried conductor or both. A conventional measurement integrates over the information depth without assigning a depth to each photon.
How Depth Affects Lateral Resolution
Spot size describes where the beam enters, not the full analytical volume. With orthogonal excitation, the excited column runs straight down beneath the spot instead of slanting sideways, as it would with oblique incidence. Even so, polycapillary-focused beams diverge below the focal plane, so signal from deep in a weakly absorbing sample comes from a somewhat wider footprint. A 20 µm spot gives close to 20 µm resolution for light elements in metals, but less for heavy elements in polymers. A smaller spot does not make the analysis shallower.
Key Point
Every microXRF map is a 2D image of signal from a 3D volume. Know what lies above and below the surface you see before interpreting it.
How to Get Depth Information with MicroXRF
Conventional microXRF maps laterally and is not a depth-profiling method on its own. These approaches add depth information:
- Map a cross section. Cutting the sample turns depth into a lateral dimension. This is ideal for coatings, corrosion, diffusion and concrete ingress.
- Model layers. Fundamental-parameter models or standards convert coating and substrate intensities into thickness.
- Compare lines. An element's low- and high-energy lines (such as Pb Mα vs. Pb Lα) show whether its signal is surface-weighted or bulk.
- Change the excitation. Different tube voltages or filters shift the relative depth sensitivity.
- Use confocal XRF. A second optic restricts the detected volume, giving true depth resolution.
Key Point
Detecting an element and locating it in depth are different problems. When depth matters, plan for it in how you prepare and measure the sample.
Quantification and Sample Preparation
Fundamental-parameter quantification assumes the sample is uniform over the information depth. Layered, coated or thin samples break that assumption and need layer models, matched standards or cross sections. Know what lies on top of and beneath the area you analyze, including oxide films, contamination and mounting media.
Key Point
Accurate quantification depends on the sample being uniform throughout the information depth of every element you report.
MicroXRF Penetration Depth FAQ
Is MicroXRF a Surface Analysis Technique?
Partly. It is surface-weighted for light elements and dense samples, but it can sample millimeters into low-density materials.
Is the Information Depth the Same for Every Element in a Map?
No. Each element's line energy and its absorption in the matrix give each map its own depth.
Why Does My Substrate Appear in the Spectrum?
The sample is thinner than the information depth, so the beam excites the support beneath it.
Can MicroXRF Tell Me How Deep an Element Is?
Not from a single conventional measurement. Use cross sections, layer modeling, line comparison or confocal XRF.
Understand What Your MicroXRF Measurement Is Really Seeing
Every microXRF measurement samples a three-dimensional volume shaped by the instrument, the sample and the element. The useful question is not "how deep does microXRF go?" but "from what depth does this element's signal come, in this material, under these conditions?"
The Atlas Apex microXRF platform combines orthogonal excitation with a high take-off angle for high-performance elemental mapping across a wide range of materials. IXRF Systems applications scientists can estimate information depths for your samples and recommend excitation conditions, preparation and analytical strategy.