Table of contents
Using MicroXRF to Visualize Thin-Film Composition and Uniformity Across a Three-Inch Wafer
Uniform deposition is critical in semiconductor manufacturing.
Variations in thin-film composition or thickness can influence electrical properties, adhesion, structural integrity, optical behavior, process consistency, and ultimately device reliability. This makes spatially resolved characterization especially valuable when multiple deposited materials must remain controlled across a wafer.
In this study, microXRF was used to examine the distribution of tin (Sn), titanium (Ti), and cobalt (Co) across a three-inch combinatorial wafer after sputtering and annealing. Elemental intensity maps and quantitative thermal maps revealed how each deposited element was distributed across the wafer, providing a non-destructive way to evaluate deposition homogeneity over a comparatively large area.
The Challenge
Verifying More Than Average Composition
Thin-film semiconductor processes are designed to deposit materials with controlled composition and distribution.
But a measurement from only one point on a wafer cannot reveal whether the deposition is consistent across the entire surface.
Localized variation can matter.
Non-uniform deposition may contribute to changes in:
- Electrical conductivity and resistivity
- Thin-film adhesion
- Mechanical integrity
- Optical behavior
- Process consistency
- Device-to-device variation
For semiconductor process development and quality control, the analytical question therefore extends beyond:
“Is Sn, Ti, or Co present?”
It becomes:
“How are Sn, Ti, and Co distributed across the wafer?”
A spatial measurement is required to answer that question.
The Sample
Three-Inch Combinatorial Semiconductor Wafer
The analyzed sample was a three-inch combinatorial wafer examined after sputtering and annealing.
The deposited materials of interest were:
- Sn — Tin
- Ti — Titanium
- Co — Cobalt
These elements were evaluated spatially across the wafer to determine how their distributions varied from one region to another.
Because the analytical objective was deposition homogeneity rather than simply elemental identification, mapping the entire wafer provided substantially more information than a single-point measurement.
The Analytical Approach
Large-Area Elemental Mapping with MicroXRF
MicroXRF uses a focused X-ray beam to excite characteristic X-ray fluorescence from a sample.
By moving the wafer relative to the X-ray beam and collecting spectra across many locations, the system can reconstruct the spatial distribution of selected elements.
For this study, the wafer was mapped using a 25 µm X-ray spot size.
The resulting dataset was used to generate:
- An elemental overlay showing the combined distribution of Ti, Co, and Sn
- A quantitative Sn thermal map
- A quantitative Co thermal map
- A quantitative Ti thermal map
This allowed the distribution of each deposited material to be examined both individually and in relation to the other elements across the wafer.
The Results
Elemental Mapping Revealed Spatial Differences Across the Wafer
The microXRF measurements produced clear spatial maps of the three deposited elements.
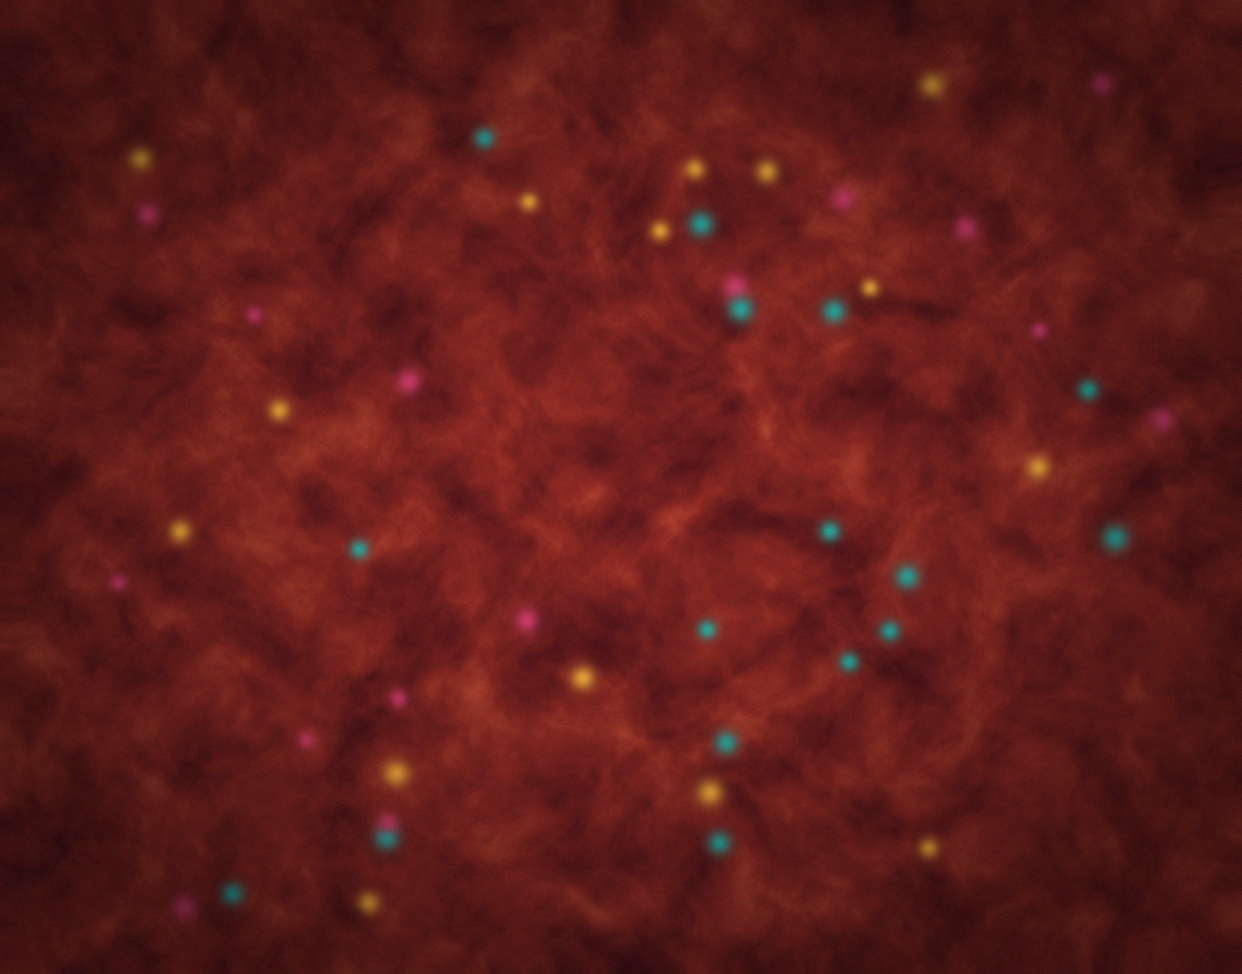
The combined Ti-Co-Sn elemental overlay made it possible to visualize how the deposited materials varied across the wafer in a single image.
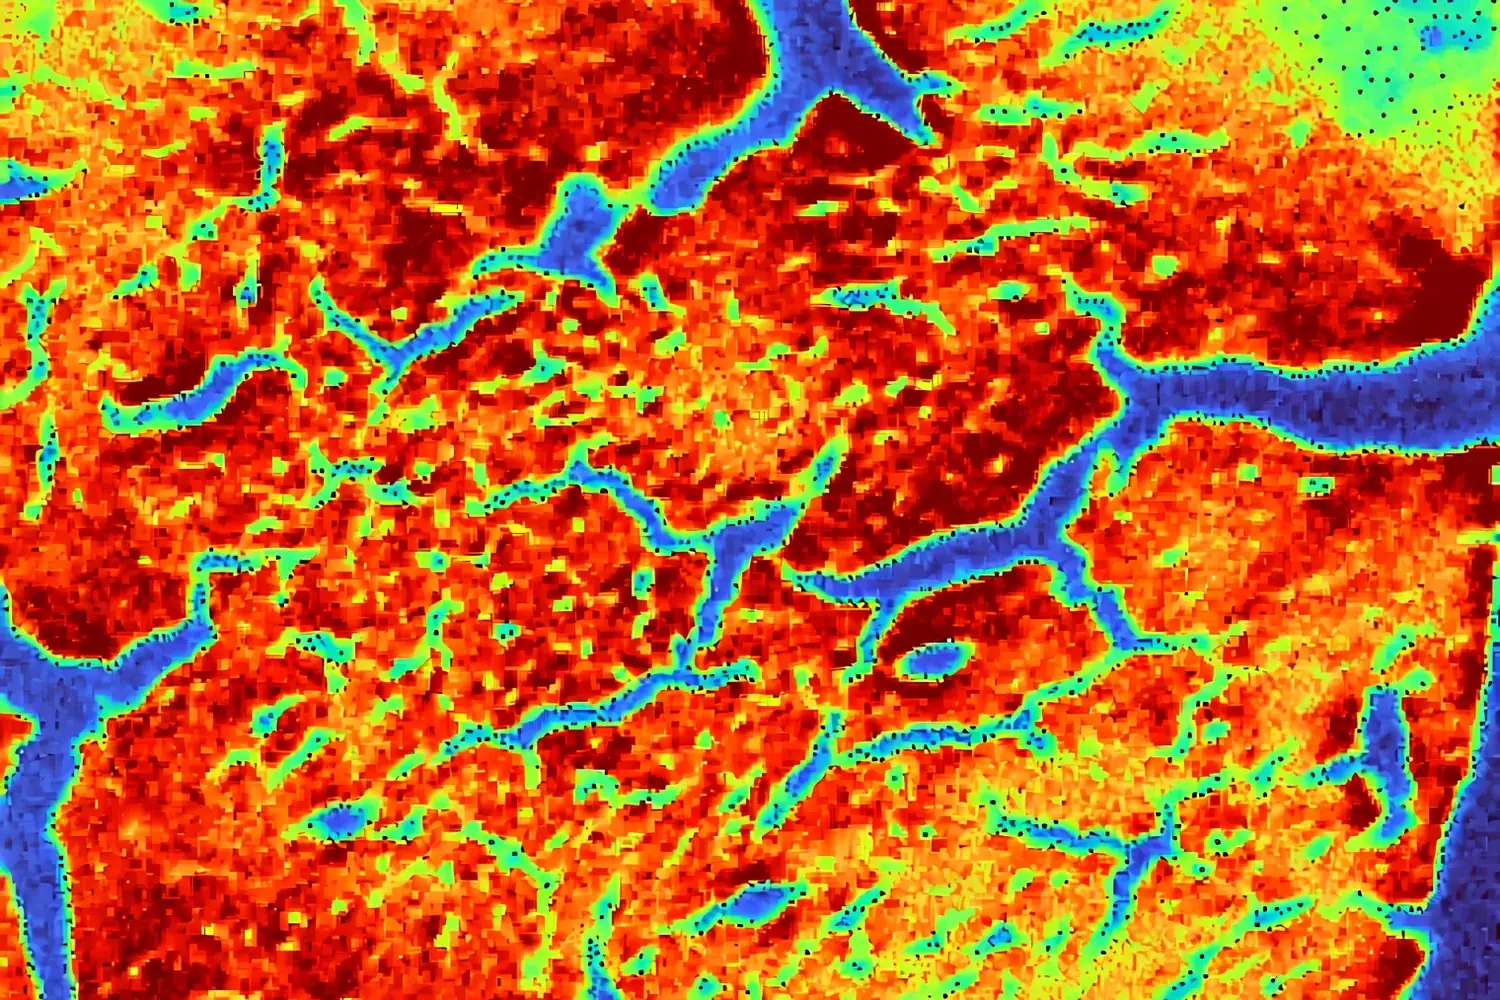
Individual quantitative thermal maps then separated the three components, allowing Sn, Co, and Ti to be examined independently.
Instead of reducing the wafer to one averaged composition value, the microXRF dataset preserved the spatial information required to evaluate deposition homogeneity.
Tin Distribution
The quantitative Sn map provided a wafer-scale visualization of how tin concentration varied spatially.
Regions of higher and lower Sn response could be distinguished directly, making it possible to assess whether the deposited material followed the intended distribution pattern.
This type of information can be useful during deposition-process development because it allows engineers to compare chemical distribution with process position, deposition conditions, or other manufacturing variables.
Cobalt Distribution
The Co thermal map independently displayed cobalt distribution across the wafer.
Separating Co from the combined elemental overlay made local changes easier to evaluate and provided a clearer picture of the relative homogeneity of the cobalt-containing layer or region.
Titanium Distribution
The Ti quantitative map provided the same spatial analysis for titanium.
Together, the three maps created a chemical picture of the wafer that could not be obtained from a single-point measurement alone.
The important result was not simply confirming that Sn, Co, and Ti were present.
It was determining where each element occurred and how its distribution changed across the wafer.
Why Spatial Uniformity Matters
Connecting Deposition Chemistry With Semiconductor Performance
Deposition homogeneity can influence several characteristics important to semiconductor manufacturing.
Electrical Properties
Variations in deposited materials can produce differences in electrical properties such as conductivity and resistivity.
Understanding spatial chemical variation therefore provides useful information when investigating electrical inconsistencies across a wafer.
Structural Integrity
Thin-film performance depends in part on uniformity and adhesion to the substrate.
Localized variations may identify regions requiring additional investigation during process development.
Optical Performance
For semiconductor structures used in photonics, photovoltaics, sensors, and other optically active devices, variations in deposited layers can affect absorption and reflection behavior.
Process Control
Mapping material distribution provides feedback on the deposition process itself.
Rather than evaluating only whether the correct material was deposited, engineers can examine how uniformly it was distributed across the wafer.
This information can contribute to deposition-process optimization and manufacturing control.
Why MicroXRF?
Non-Destructive Chemical Imaging Across Large Areas
Semiconductor metrology often requires analytical techniques capable of examining increasingly small features.
But maximum spatial resolution is not the only requirement.
For deposition studies, researchers may also need to understand how composition changes across an entire wafer or other comparatively large sample area.
MicroXRF provides a useful combination of:
- Spatially resolved elemental analysis
- Large-area mapping
- Non-destructive measurement
- Broad elemental coverage
- Quantitative analysis
- Minimal sample preparation
This makes it particularly useful for bridging the gap between bulk compositional measurements and very localized microscopic characterization.
Beyond Sn, Ti, and Co
The same microXRF approach can be applied to other semiconductor and microelectronics challenges where elemental distribution matters.
Potential workflows include:
Thin-Film Uniformity
Map elemental composition across deposited films to identify spatial variation.
Bump and Pillar Analysis
Investigate elemental composition associated with solder bumps, pillars, and related interconnect structures.
Under-Bump Metallization
Evaluate materials used in UBM structures and examine their spatial distribution.
Multilayer Structures
Analyze elemental differences across film stacks and multi-stack systems where composition changes between regions.
Corrosion and Surface Coatings
Identify elemental variation associated with protective coatings, corrosion-resistant materials, or surface degradation.
Contamination Investigation
Locate unexpected elemental signals and determine whether contamination is isolated or distributed across a larger region.
These applications share a common analytical requirement: understanding where material chemistry changes, not simply identifying which elements are present.
A Practical Semiconductor Metrology Workflow
MicroXRF can be integrated into a broader process-development or failure-analysis workflow.
1. Map the Wafer or Component
Begin with a large-area elemental map to establish overall compositional distribution.
2. Identify Non-Uniform Regions
Use elemental intensity or quantitative maps to locate areas that differ from the expected deposition pattern.
3. Compare Individual Elements
Separate overlay data into individual elemental maps to determine which deposited material contributes to the observed variation.
4. Quantify Regions of Interest
Where appropriate, quantitative analysis can provide additional information about composition within selected regions.
5. Correlate With the Manufacturing Process
Compare elemental distributions with deposition location, process parameters, thermal treatment, electrical testing, or other process data.
6. Escalate Selected Features for Additional Analysis
Regions identified by microXRF can be investigated using complementary techniques when additional structural or higher-spatial-resolution information is required.
This survey-to-detail approach allows large-area chemical information to guide more targeted characterization.
The Value
From Element Identification to Deposition Control
This case study illustrates an important advantage of microXRF for semiconductor materials characterization.
A conventional compositional measurement can confirm that Sn, Ti, and Co are present.
MicroXRF adds another dimension:
spatial distribution.
For the three-inch combinatorial wafer, elemental and quantitative maps showed the distribution of each deposited material across the sample. This type of information can help researchers and process engineers evaluate whether deposition behavior is consistent with expectations and identify areas that warrant further investigation.
The Takeaway
See Where Semiconductor Chemistry Changes
Semiconductor reliability depends on controlling materials at increasingly demanding scales.
When deposited layers vary across a wafer, an average composition value may not provide enough information to understand the process.
MicroXRF enables researchers to visualize elemental distribution across large areas while retaining the spatial resolution needed to investigate localized compositional variation.
In this study, mapping a three-inch combinatorial wafer with a 25 µm X-ray spot produced individual and overlaid maps of Sn, Ti, and Co, providing a direct view of deposition distribution and uniformity.
For semiconductor R&D, thin-film development, process optimization, and quality control, microXRF provides a practical way to answer a critical question:
Is the material simply present, or is it distributed where it is supposed to be?
Explore MicroXRF for Semiconductor & Microelectronics Analysis
See how Atlas microXRF technology can support thin-film characterization, wafer mapping, elemental uniformity studies, contamination analysis, and semiconductor process development.