Table of contents
Overcoming Spectral Overlap and Trace-Element Limitations in Metallurgical Analysis
High-performance alloys depend on precise control of elemental composition.
In applications involving refractory metals and specialty alloys, even relatively small compositional differences or unexpected contaminants can matter. But identifying those elements is not always straightforward, particularly when characteristic X-ray peaks overlap or when the elements of interest occur at concentrations below the practical sensitivity of the selected analytical technique.
In this case study, energy-dispersive spectroscopy (EDS) and microXRF were compared directly on rhenium-containing alloy samples, including a small wire and a hexagonal rod.
The objective was to identify rhenium and investigate iron contamination within the material.
The comparison exposed a fundamental difference between electron- and X-ray-excited elemental analysis.
With EDS, the accessible rhenium signal overlapped with a tungsten X-ray line, preventing reliable identification. With microXRF, higher-energy excitation produced the rhenium Lα peak at approximately 8.6 keV, clearly separating the rhenium signal from the interfering tungsten line.
MicroXRF also revealed trace iron and cobalt signals that were not detected by EDS.
The study demonstrates why excitation physics, spectral interference, and detection sensitivity can be just as important as spatial resolution when selecting an analytical technique for metallurgical characterization.
The Challenge
Identifying Rhenium in a Complex Refractory-Metal Matrix
Rhenium is used in demanding metallurgical applications because of its exceptional high-temperature properties.
It is particularly valuable in high-performance alloy systems used where thermal stability and mechanical performance are critical.
But analyzing rhenium can present a practical spectroscopy problem when other heavy elements are present.
The samples investigated in this comparison included:
- A small rhenium-containing wire
- A hexagonal rod
- Tungsten within the analytical matrix
- Potential iron contamination
The key analytical questions were:
- Can rhenium be identified reliably in the presence of tungsten?
- Can lower-level contaminants or minor constituents also be detected?
EDS and microXRF were used to answer those questions.
The EDS Measurement
Electron Excitation Produced a Difficult Spectral Overlap
The wire sample was analyzed by EDS using an electron-beam energy of 20 keV.
Under these conditions, the rhenium signal available for identification was the Re Mα line at approximately 1.8 keV.
The problem was that this peak overlapped with a tungsten X-ray line.
That spectral interference made it impossible to distinguish the rhenium contribution reliably using the EDS spectrum alone.
For routine materials characterization, an overlapping peak may be manageable when alternative spectral lines provide sufficient information.
In this case, however, the available excitation conditions limited the usefulness of those alternatives.
The problem was therefore not simply detector energy resolution.
It was also a question of which characteristic X-ray lines could be efficiently excited and measured.
The MicroXRF Measurement
Higher-Energy X-Ray Excitation Opened a Better Analytical Line
The same sample was analyzed by microXRF using 35 keV X-ray excitation.
That higher excitation energy allowed the measurement to access the rhenium L-series fluorescence, including the Re Lα peak at approximately 8.6 keV.
At this energy, the rhenium peak was spectrally separated from the tungsten interference that complicated the EDS analysis.
The result was a clear rhenium identification.
This illustrates an important principle in X-ray spectroscopy:
Choosing a different excitation mechanism can change which elemental emission lines are available for analysis.
For heavy elements such as rhenium, tungsten, platinum, and other refractory or precious metals, access to higher-energy characteristic lines can provide a significant analytical advantage.
The Spectral Comparison
The Difference Was Visible Directly in the Overlaid Spectra
The original study overlaid spectra collected from the wire sample using both techniques:
- EDS: 20 keV electron excitation
- MicroXRF: 35 keV X-ray excitation
The EDS spectrum showed the difficulty associated with the low-energy rhenium signal and tungsten interference.
The microXRF spectrum, by contrast, provided access to the higher-energy rhenium Lα peak.
This direct comparison demonstrates why a technique should not be selected based solely on whether it is theoretically capable of detecting an element.
A more useful question is:
Can the technique excite and resolve an analytically useful line for that element within the actual sample matrix?
For this rhenium-containing material, microXRF provided the more useful answer.
The Results
1. MicroXRF Clearly Resolved Rhenium
The principal analytical result was successful separation of the rhenium signal from tungsten.
EDS relied on the lower-energy Re Mα peak near 1.8 keV, where spectral overlap complicated identification.
MicroXRF excited the Re Lα peak near 8.6 keV, providing a clearly resolved rhenium signal.
For refractory-metal and high-performance-alloy analysis, this capability can be critical when overlapping low-energy peaks make identification ambiguous.
2. Trace Iron Was Detected by MicroXRF
The study also sought evidence of iron contamination.
MicroXRF resolved trace iron that was not detected in the corresponding EDS measurement.
For specialty metals, the ability to identify low-level contamination can be valuable in:
- Incoming-material inspection
- Process monitoring
- Failure analysis
- Alloy verification
- Contamination investigations
- Quality assurance
The importance of a trace constituent depends on the alloy and application, but the case study demonstrates that differences in analytical sensitivity can determine whether the signal is observed at all.
3. Cobalt Was Also Revealed
In addition to iron, microXRF detected a trace cobalt signal that EDS did not resolve in the comparison.
This is particularly useful when the analytical objective extends beyond verifying the principal alloying elements.
Unexpected minor or trace constituents can provide clues about:
- Raw-material purity
- Cross-contamination
- Manufacturing history
- Processing equipment
- Alloy segregation
- Material provenance
An analytical method capable of revealing those lower-level signals can therefore provide information beyond basic alloy identification.
Why Heavy-Element Analysis Benefits From Higher-Energy Excitation
Not All Characteristic X-Ray Lines Are Equally Useful
Each element can produce several families of characteristic X-ray lines.
For heavy elements, the lower-energy M-series lines may occur in crowded regions of the spectrum where overlaps are more common.
Higher-energy L-series lines may provide cleaner separation, but those lines require sufficient excitation energy.
This is where the difference between the two techniques became important in this study.
EDS
Electron excitation at 20 keV provided access to the rhenium M-series signal but did not provide an analytically useful separation from tungsten.
MicroXRF
X-ray excitation at 35 keV generated the higher-energy rhenium L-series fluorescence needed for a clear identification.
This same principle can become relevant when analyzing other high-atomic-number materials.
Quantitative Analysis
Moving From Identification to Concentration
Once an element has been reliably identified, the next question may be:
How much is present?
The source study describes a standards-based microXRF quantification approach using calibration standards of known composition.
A calibration curve can be established by measuring standards containing known concentrations of the target element.
The unknown sample is then measured under controlled conditions and compared with that calibration relationship.
For rhenium and other challenging alloy constituents, this creates a path from:
Element identification → calibrated measurement → concentration
The quality of the quantitative result depends on factors including:
- Calibration standards
- Sample matrix
- Surface condition
- Geometry
- Excitation conditions
- Counting statistics
- Calibration methodology
The important point from this case is that reliable quantification first requires a spectral signal that can be distinguished from interfering peaks.
Sample Geometry Matters
Wire and Rod Samples Do Not Always Fit an Ideal SEM Workflow
The samples used in the study included a small wire and a hexagonal rod.
These geometries illustrate another practical difference between metallurgical analysis methods.
EDS measurements are commonly performed on specimens prepared for stable electron-beam analysis, often favoring relatively flat, polished surfaces and vacuum-compatible geometries.
MicroXRF can accommodate a wider range of shapes and sizes with less extensive preparation.
Potential metallurgical specimens can include:
- Wires
- Rods
- Coupons
- Fasteners
- Machined components
- Coated parts
- Fracture specimens
- Irregularly shaped material
This can make microXRF useful for rapid screening before deciding whether cutting, mounting, polishing, or other destructive preparation is justified.
Non-Destructive Analysis
Preserve the Sample for Additional Investigation
MicroXRF uses X-rays to excite the material and does not require material removal during the measurement.
For valuable or limited specimens, this allows the original component to remain available for:
- Additional XRF measurements
- SEM investigation
- Mechanical testing
- Metallography
- Failure analysis
- Archiving
This can be particularly important for specialty metals, aerospace components, prototype materials, and failure-analysis specimens where only one sample may be available.
A Better Metallurgical Workflow
Use Each Technique Where It Is Strongest
The case study should not be interpreted as showing that microXRF universally replaces SEM-EDS.
SEM-EDS remains highly valuable for:
- High-resolution imaging
- Microstructural analysis
- Small inclusions
- Grain-boundary characterization
- Localized chemistry
- Correlation between morphology and composition
MicroXRF provides different advantages:
- Higher-energy excitation
- Trace-element sensitivity
- Large-area mapping
- Broad elemental screening
- Minimal sample preparation
- Flexible sample geometries
A practical metallurgical workflow can therefore combine them.
Step 1: Screen the Material With MicroXRF
Use microXRF to identify:
- Principal alloying elements
- Trace contaminants
- Unexpected constituents
- Elemental segregation
- Spatial variation
For heavy-element alloys, select excitation conditions capable of accessing useful higher-energy emission lines.
Step 2: Map the Elemental Distribution
If compositional heterogeneity is suspected, collect elemental maps.
These can reveal:
- Segregation
- Inclusions
- Contamination
- Coating variation
- Diffusion zones
- Weld or interface chemistry
This creates a chemical overview of the specimen.
Step 3: Identify Regions of Interest
Use spectra and elemental maps to locate regions that differ from the surrounding material.
These regions can then be targeted for more detailed analysis.
Step 4: Move to SEM-EDS When Higher Spatial Resolution Is Needed
If the analytical question requires grain-scale imaging, microstructural detail, or investigation of very small inclusions, transfer selected regions to SEM-EDS.
This turns the workflow from:
search first, characterize later
into:
chemically locate first, then characterize.
Applications in Metallurgy
The analytical advantages demonstrated by the rhenium alloy comparison extend to several metallurgical workflows.
High-Temperature and Refractory Alloys
Elements such as:
- Re
- W
- Ta
- Hf
- Pt
can occur in alloy systems designed for demanding thermal environments.
High-energy X-ray excitation can provide useful access to characteristic lines for these heavy elements.
Superalloys
Nickel- and cobalt-based superalloys contain complex mixtures of major, minor, and trace elements.
MicroXRF can support investigations of:
- Alloy composition
- Segregation
- Trace contamination
- Coating chemistry
- Diffusion regions
- Failure-analysis specimens
Corrosion-Resistant Alloys
Stainless steels and other corrosion-resistant materials rely on controlled elemental composition.
MicroXRF can help compare alloy chemistry and identify compositional variations or unexpected constituents.
Quality Control of Specialty Metals
Manufacturers can use microXRF to screen:
- Incoming raw materials
- Wires
- Rods
- Finished components
- Specialty alloy products
The ability to analyze unusual sample shapes with minimal preparation can simplify inspection workflows.
Coatings and Platings
MicroXRF can also evaluate metallic coatings and plated structures.
Depending on the application and calibration method, analysis may address:
- Elemental composition
- Coating uniformity
- Layer distribution
- Thickness
Materials such as gold, platinum, and other high-value coatings are particularly well suited to XRF-based characterization.
The Value
Resolving What EDS Could Not
The rhenium alloy comparison demonstrates several practical advantages of microXRF for metallurgical analysis.
Clear Rhenium Identification
MicroXRF accessed the Re Lα peak at approximately 8.6 keV, avoiding the tungsten interference that complicated the Re Mα signal measured by EDS.
Detection of Trace Constituents
Iron and cobalt signals were resolved by microXRF but were not detected in the EDS comparison.
Standards-Based Quantification
Once the target element was spectrally resolved, calibration standards could be used to support quantitative analysis.
Flexible Sample Geometry
Wire and hex-rod specimens could be examined without requiring the extensive preparation associated with many microscopy workflows.
Non-Destructive Measurement
The specimens remained available for further analysis.
Together, these advantages demonstrate why the excitation method itself should be considered when selecting an elemental-analysis technique for complex alloys.
The Takeaway
The Best Elemental Technique Depends on the Spectral Problem
EDS and microXRF both use characteristic X-rays to identify elements, but they do not generate those X-rays in the same way.
That difference can fundamentally change the analysis.
In this rhenium alloy case study, EDS at 20 keV relied on a low-energy rhenium Mα signal near 1.8 keV that overlapped with tungsten.
MicroXRF analysis at 35 keV excited the higher-energy Re Lα signal near 8.6 keV, allowing rhenium to be clearly resolved.
The microXRF spectrum also revealed trace iron and cobalt signals not detected by EDS.
The result illustrates an important principle for metallurgical characterization:
When spectral overlap or trace-element sensitivity limits one technique, changing the excitation method may reveal information that was previously inaccessible.
For high-performance alloys, refractory metals, quality control, contamination analysis, and failure investigations, microXRF provides a complementary elemental-analysis capability that can extend well beyond conventional EDS screening.
Explore MicroXRF for Metals and Alloys
Need to investigate refractory metals, trace contaminants, alloy composition, coatings, or spatial elemental variation?
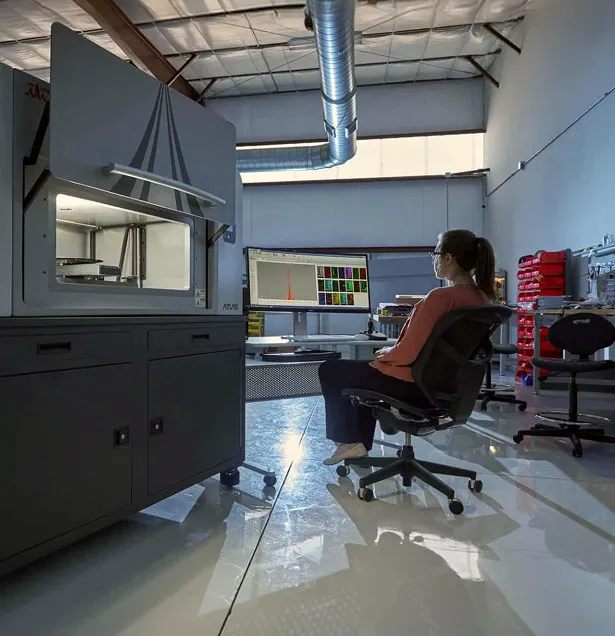
See how Atlas Apex microXRF can add high-sensitivity elemental information to your metallurgical characterization workflow.